Consulting, Dynamics AX Introduction
Beginning Management Reporter Tutorials: Part 1 – Your first trial balance
 17576
17576 
Nov
Exercise 1:
Your First Trial Balance – A trial balance allows us to instantly see the financial value of every single account. For those of you new to financial concepts, think of it as a running sum which tells you where the money is being spent at a particular point in time. Dynamics AX comes with this already out of the box but that report isn’t nearly as powerful as what you can do with Management Reporter. Do not forget: when I am all finished with posting these tutorials, the trainer shall return and make videos. It has been busy lately; I’m running full implementation projects as a techno-functional BI specialist and consultant, but the trainer is still within me. I could never give up training because I love it. Just hang with me while I work out a hectic schedule.
NOTE: I am using the sample image that Microsoft provides for Dynamics AX 2012 R2, but that is not a prerequisite. You need to have one of the Dynamics products installed – GP, SL, AX, or NAV. Then, you may substitute your own data in place of the data that I am using here. Management Reporter, is, after all, a client side reporting tool that specializes in financial reporting needs. Think of it as Report Builder for Financial data within Microsoft Dynamics Products.
Introduction provided here:
http://instructorbrandon.com/beginning-management-reporter-tutorial-series/
-
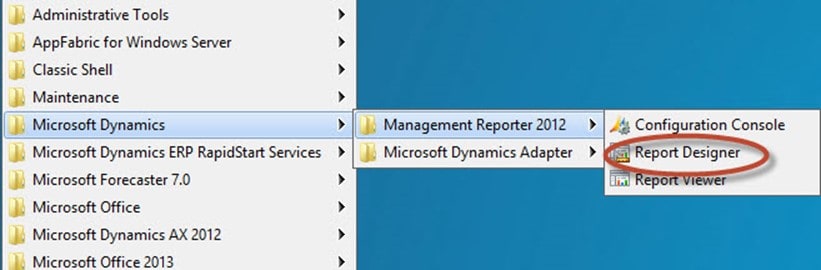
Open up Report Designer. Note that your location will be different depending on what you use to open it up. Report Designer is where we do all of our report writing business.
-
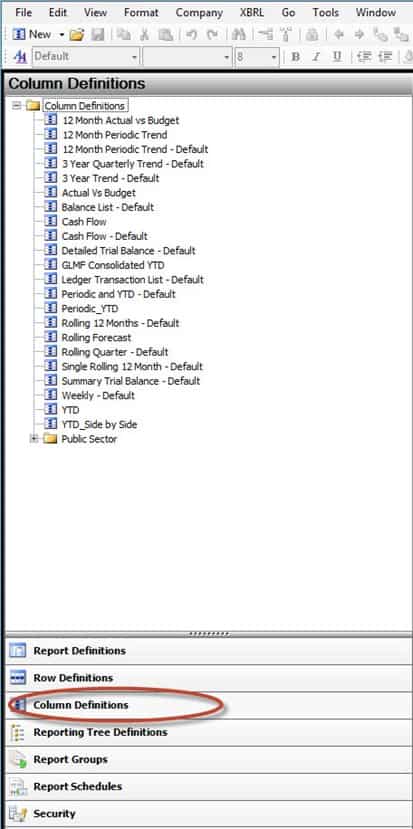
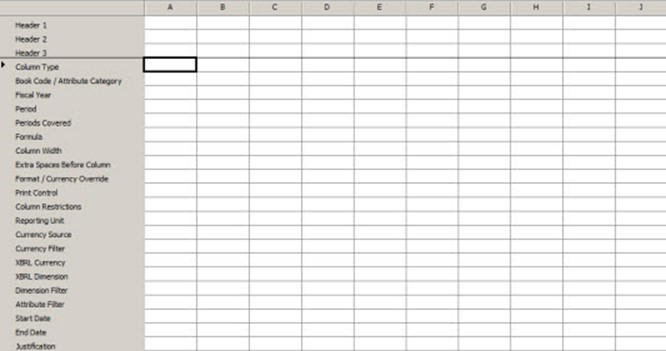
Left-click on Column Definitions to begin. With Management Reporter, you design columns first to determine the layout and graphical feel of your report. You design rows next to determine which data goes into that layout. So remember, a column definition is the design template for your report. What is so cool is that multiple reports can use the same design template really speeding up development!
-
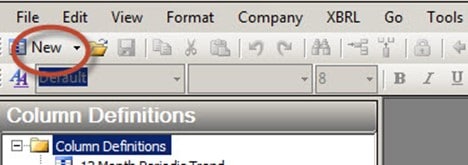
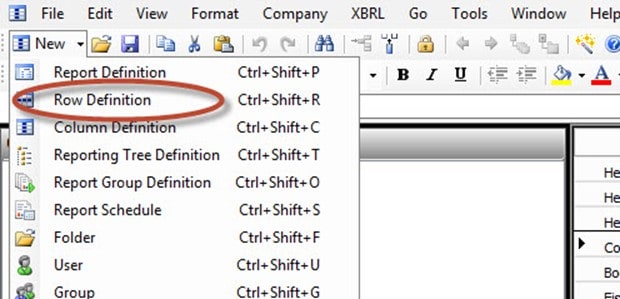
Click the little “New” option on the menu and a drop down will appear with an option called Column Definition.
If you are a developer wishing to learn more then it may be wise to check out our Boot Camp, which takes you from zero to hero with some serious hands-on lab action.
-
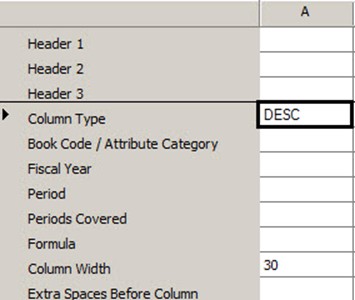
Double-left click in the Column Type column for column A. Choose column type DESC for description. A Desc column means that you are about to put in a row description. So, this column will contain words. You can write in your own words or let them autogenerate from the row data. On the bottom, there is a limit of 30 characters for the column width. Change as you like.
-
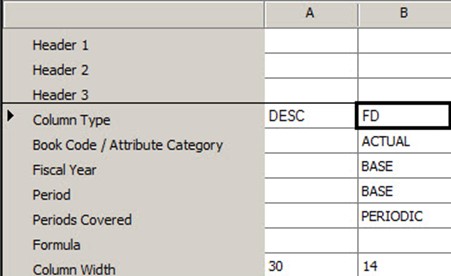
Double-left click in the Column Type column for column B. Choose FD for the column type. Now FD is a special type of column that means numeric data. In the Book Code, you will see the value Actual. This means that this is the real data. You will see the Fiscal Year, which means the year to run the column against as “Base”. Base here means use the default settings on the report. You will see the periods covered as Base. Now, what you will understand from our demo is that base really refers to the way that you setup financial summarizations in Dynamics AX. For example, some companies have a base period of a year. Other companies have a base period of a month.
-
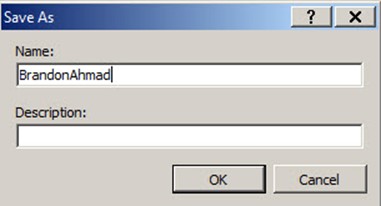
Click File à Save and give the column your first and last name. So, to summarize.. you have just built 2 columns. One column will have words that you put in. Another column will have data that covers a time span defined somewhere (we’ll see the somewhere later).
-
Now, we need to actually fill the report with data. The row definition is where you do this. In this case, let’s say that we want all the data on accounts 821000 to 899801. Click the New button as in Step 3, and choose Row Definition.
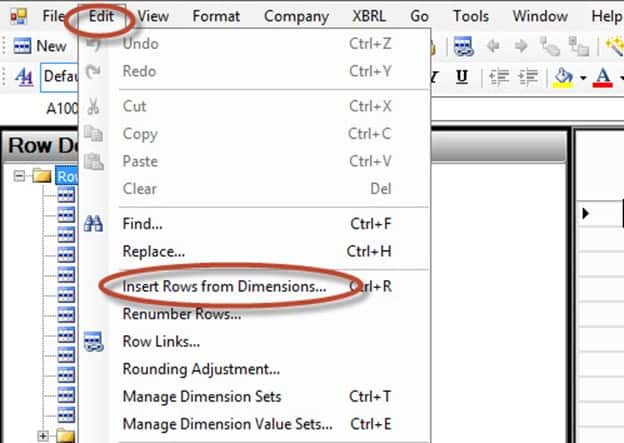
- Click the Edit command and choose Insert Rows from Dimensions
-
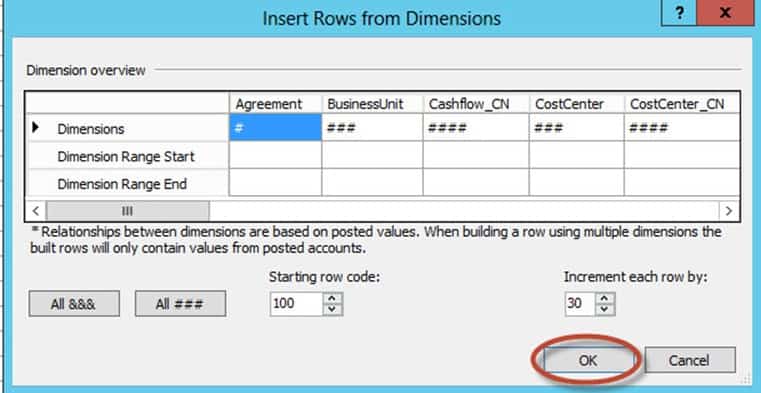
Here is a cool example of how you can save yourself time. Put in a range of accounts that you need to see some financial data on. That way, you don’t have to manually type them all in. You could type them all in, but that is a lot of work. Dynamics AX will automatically populate the names of the accounts also which really saves time. Here we will select every single account for the company which is really easy to do. Just click OK when finished and watch management reporter do it’s magic.
- Unlike the Column definition, the columns labeled A, B,C, ect here have nothing to do with the actual design template of the report. So, please don’t get confused. Let’s discuss what they mean here:
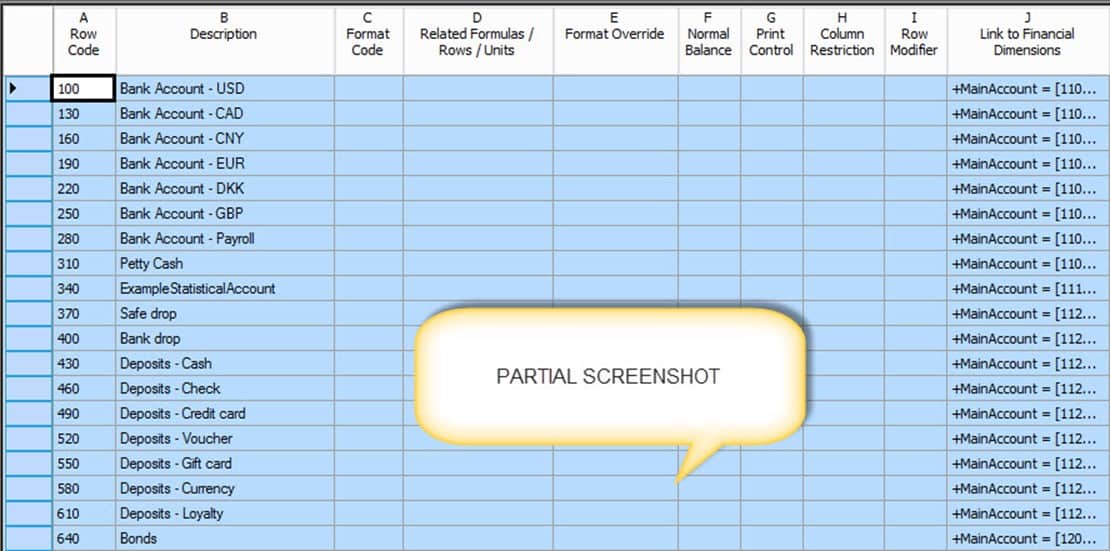
TABLE 1: What Column Letters Really Mean in Dynamics AX
| Column Letter | What it really means |
| A | This is the row code. You will use this for calculations like summing up rows 30 through 100, for example. |
| B | Every row needs to have one column describing it. This column will go into the column within a column definition called Description. |
| C | The Format code gives you all kinds of flexibility. Basically, think of it as a place to specify that you want your own data to fill a row. Sometimes, that data may just be a line or it is some formula to summarize rows as in a total row. |
| D | Some rows need formulas to help them generate data. This is where you enter them. |
| E | Even though it is best to leave elements of design, like formatting, to columns, there are times where we have to define individual formatting per a row. |
| F | Sometimes, we have to reverse the sign. Some companies may record expenses with a positive sign, for example. Depends. If you ever have to reverse the sign, choose the letter C. |
| G | Sometimes, you want to turn a row to currency even though it is not in the definition. Or, you want to prevent a row from printing on the report (in other words, a row doesn’t display on the current report but is used in calculations) |
| H | Sometimes, you don’t want certain columns to show values in this row. Easy to do: just specify the columns as A, B, C, D, E, ect. |
| I | Sometimes, you want to force your own data to show in the row. For example, the beginning balance on an account for the specified date range. |
| J | In the most common case, you need to tell Dynamics AX where to get data. Dimensions are where you do that. |
- Now Save the row definition with your first and last name. Click File à Save.
-
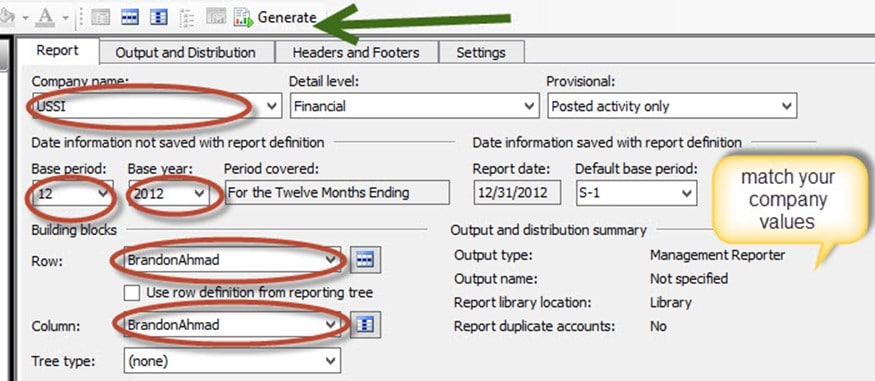
Finally, to finish up Exercise 1, we’ll go to Report Definition. The truth of the matter is that columns definitions and row definitions are just templates. It is the Report Definition where you truly run a report. The report definition can be thought of as the actual report that you run which people see in print. Click on the New button that you clicked on in Step 3 and choose Report Definition. Note: I’ve circled areas that I’ve changed for those of you who are not using the Dynamics AX 2012R2 sample image. Basically, you need to change the company name to the current name of your company that has financial data. Change the base period to some year and month that you know you have data for in your Dynamics System. Make the Row your name hopefully. Make the Column your name hopefully. What I am looking for here is that you get a feel for the fact that row definitions are the lines of data that populate a report. Column definitions are the design that governs the look and feel and organization of those rows. A report definition is where you combine the row and column definitions to get a full blown report.
You will end up with a screen that looks similar to this:
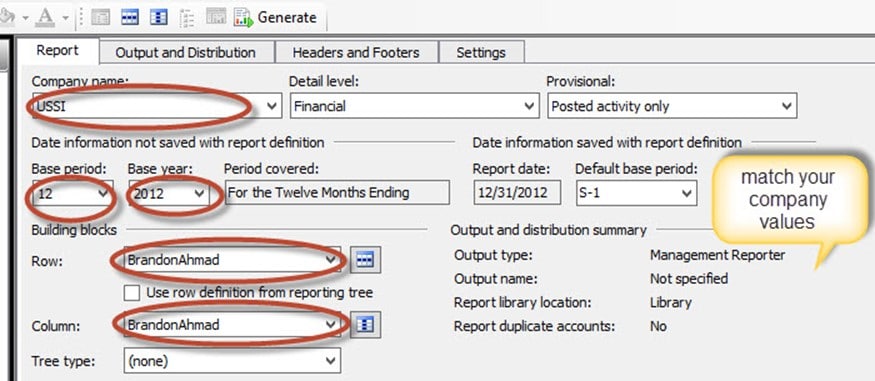
- Now, you will notice that there are 4 tabs: Report, Output and Distribution, Headers and Footers, and Settings. In this Exercise, we will only focus on the Report tab for now. For this step, review the following table which contains an explanation of what the fields mean:
| Table 2: What fields mean in Report | |
| Field | What it Means |
| Company Name | This is the company that you will analyze financial data against. By default, a financial report will run against one company. Some organizations only have one company. Others have many. |
| Detail Level | This is where you decide how deeply you want to go. You can drill down to individual transactions on the ledger if you please. The first level just has summarized data. |
| Provisional | Posted or Unposted data for analysis.. It is your choice. Nice option. |
| Base Period | Period is a setting that looks at your source system setup and refers to it. Period 8, under this calendar, would be August. What makes Base Period and Base Year exceptional is that you can run a report over them right before the report is rendered and it is not saved within the report definition. |
| Base Year | Year also looks at the years and lets you run a report against one of the years |
| Default Base Period | These become very helpful when you autorun reports, such as emailing reports to people. You can tell the report to always run on the current system date (the date on the computer) or to run against the current open period in the Dynamics system minus or plus some number, for example. In other words, you make a report that you don’t want to have to mess with. |
| Row | This is the row definition aka row template that will be used for filling in the data |
| Column | This is the column definition aka column template that will be used for filling in the data |
| Tree Type | This is the tree that will be used for slicing and dicing the data – in other words, seeing the data from multiple groupings or ‘buckets’ |
-
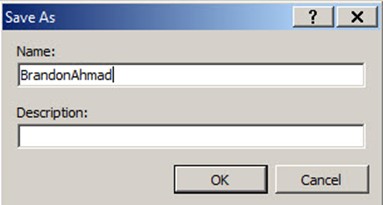
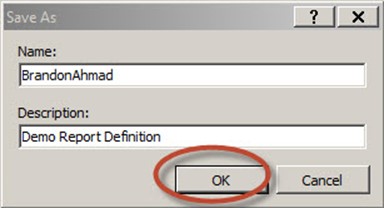
Change the values of Base Period to 6 and Base Year to 2013. Change the value of Row to the name of the Row Definition that you created earlier. Change the value of Column to the Column Definition that you created earlier. Leave the value of Tree Type alone. When you are all done, hit the
Save button or use file-save like we did in Step 7. In the name field, enter your name and click the OK button.
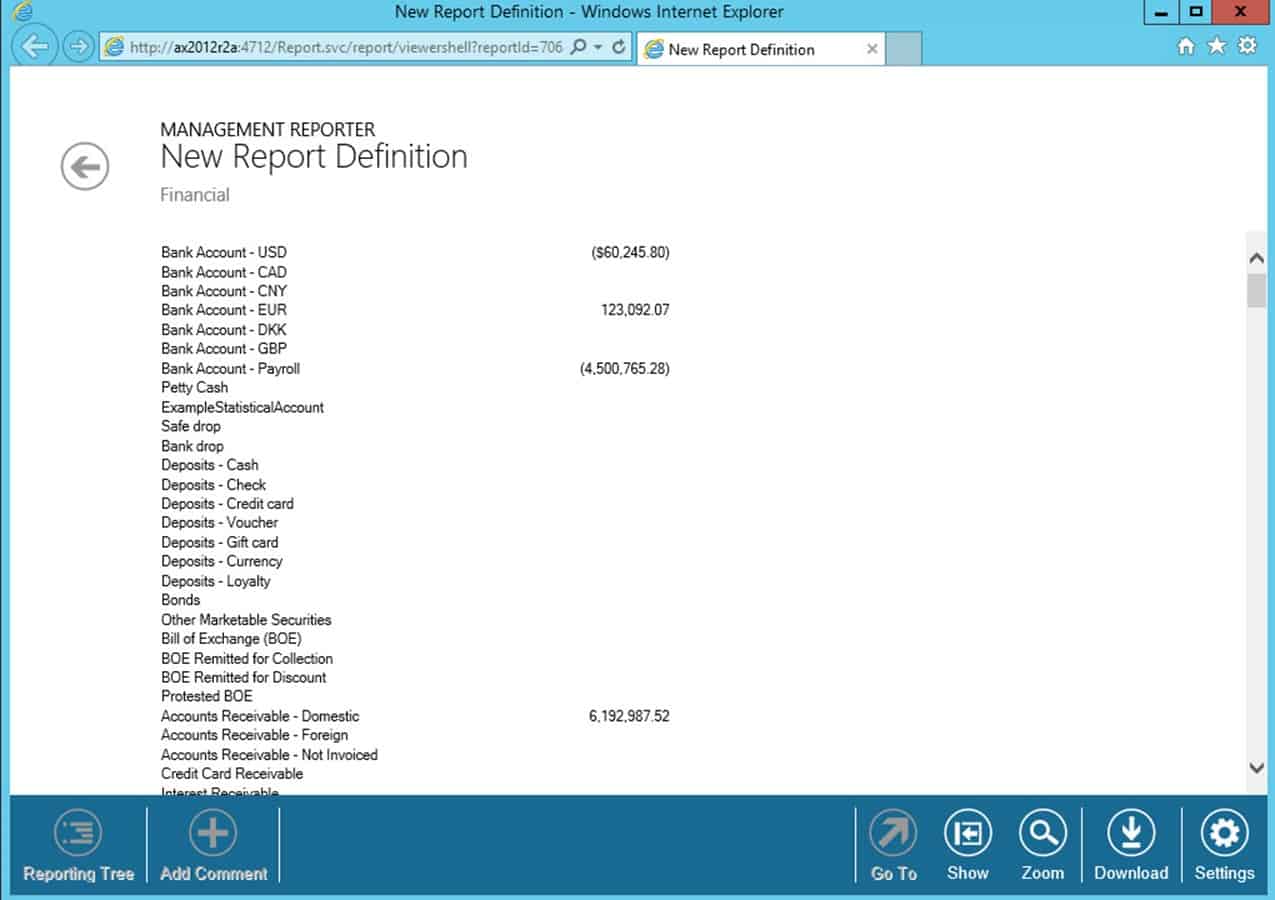
And finally, hit Generate when your report looks something like this.
-
Congrats, you just built your first Management Reporter report. The report is ugly at the moment, but we’ll see how to fix that later. Notice the common themes in management reporter – ease of development, no code approach, straight focus on the data. I like it a whole lot!