Consulting, Microsoft Dynamics AX
Beginning Management Reporter Tutorials – Part 2: Your first Column Definition
 16049
16049 
Nov
With Exercise 2, you continue to develop with this incredible no-code, yet powerful approach to developing. I want you to understand that Management Reporter has never been about difficulty with development. Truth be told, the tool is significantly easier to use than SSRS or Crystal Reports (at a cost of the more advanced control that these tools give you). Now, the subject of financials isn’t easy, which is what scares most people away from Management Reporter. But the tool has never been the issue. I’ve traveled all over the world to write reports for different companies (I’m sitting in a hotel room writing this tutorial as I work with a client right now). Let me tell you: I’ve never seen any report tool with a quicker learning curve than Management Reporter once people begin to understand it.
http://instructorbrandon.com/beginning-management-reporter-tutorial-series/
Scenario: You’ve now been asked to make a full-blown financial report with Month to Date values for actual and budget, along with variance. It would also be good to see a Variance percentage column. You would also like to add some formatting to the design. In other words, you need to make something professional.
Financial data reporting is all about structure. And we often find is that the data in our reports changes, but the layout stays the same. How different does a yearly income statement form factor need to be from a monthly income statement. Wouldn’t it be great if we could keep the same layout when making similar financial reports but use different data? Our hero, the column definition does this.
Remember: A column definition is a template which determines how the columns will look on your report – don’t forget!
(I use the sample image from the Dynamics team AX 2012 R2, but anyone could do this tutorial series with any version of management reporter. Just substitute where I tell you to and you will be fine).
- First, you need to identify the columns that are listed. Note: beginning report writers always lose the importance of a good functional specification. Here I just give you a table. One day, perhaps next year, I would love to make a series on how to properly perform a BI specification. It is becoming a lost art form now days. Review the following table as a suggested template for beginning the process:
| Column | Column Type | Formula or what it does | Special Formatting |
| A | Acct | Displays the Account Number from the ledger | Default 15 characters |
| B | Desc | Displays a description for the account either from the ledger or one that you manually type in. | Default 30 characters |
| C | FD: Actual | Displays Actual Account data for the specified base period in the Report Definition by default | Don’t format here. Will do later |
| D | FD: Base | Displays Budget Data for Account with the specified base period in the Report Definition by default | Don’t format here. Will do later |
| E | Calc | Columns D – C so that we can get the variance (in this case budget minus actual) | Don’t format here. Will do later. Format here. We will need it. |
| F | Calc | Columns E/D so that we can get the variance percentage | Need to format here. Negative values appear in parenthesis. No more than 1 digit followed by 2 decimal points |
| G | FD:Actual | FD:Actual but with Year To Date Add-In calculation | Don’t format here |
| H | FD:Budget | FD:Budget but with Year to Date Add-in calculation | Don’t format here |
| I | Calc | Columns H – G so that we can get the variance (in this case budget minus actual) | Don’t format here |
| J | Calc | Columns I/H so that we can get variance percentage | Need to format here. Negative values appear in parenthesis. No more than 1 digit followed by 2 decimal points |
-
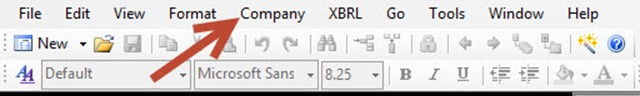
Now, for those of you following along with the sample Dynamics AX image, I want you to change your default company to one that has a budget. For those of you who don’t have Dynamics AX or the sample image, you will need to create two budgets to do this data. Click on the Companies option option underneath the Company option that the arrow is pointing towards. (make sure that you have Management Reporter Designer open first)
-
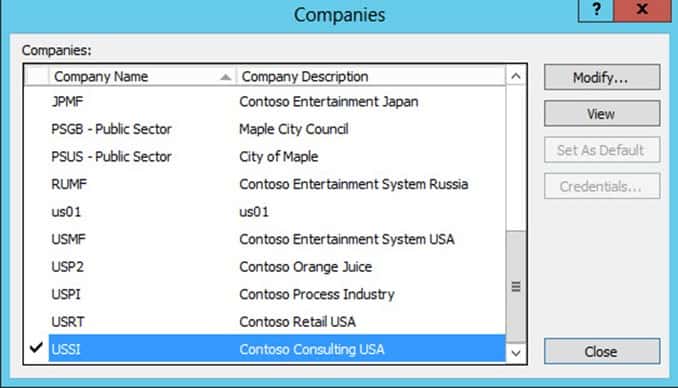
I the pop-up find USSI and click on Set as Default. What you are doing is telling Management Reporter the default company to get data from. In this case, I’m having you use USSI if you have the Dynamics Image. If not, skip this step and set it to whatever company has data for your installation. Click the Close button after you are finished setting the company value to USSI like the picture.
-
Create a new Column Definition like you did in Exercise 1 (the exercises build on themselves, so don’t forget to do exercise 1 first). Leave it blank for now.
-
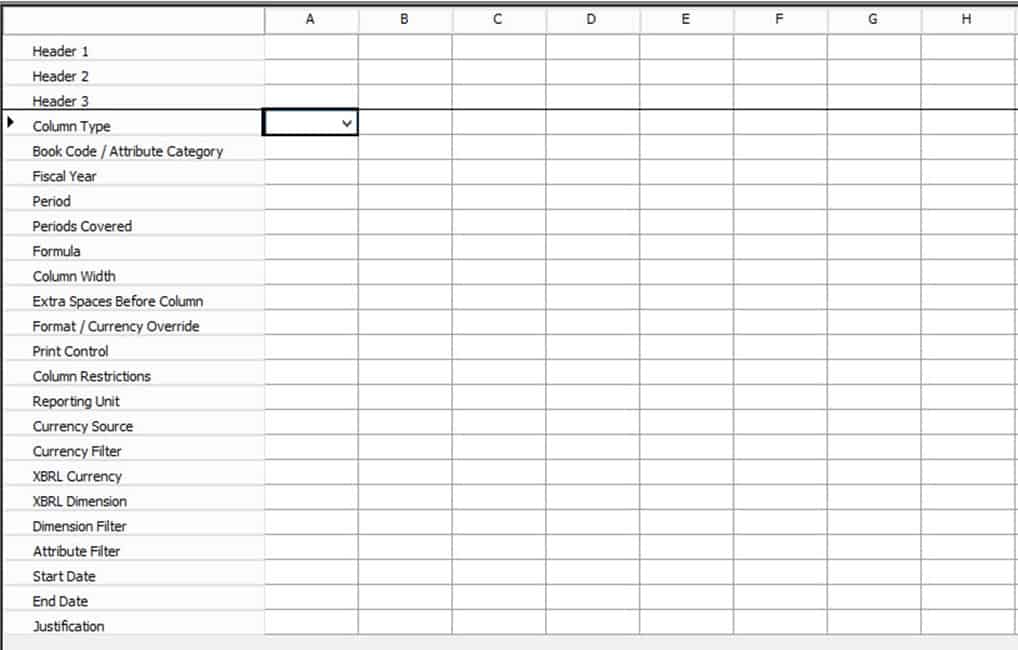
Now, to get busy. Column A, which is the first column, needs to display Account Codes. Go back to the column definition with your name on it (see previous steps on how to find the column definition if you have forgotten).
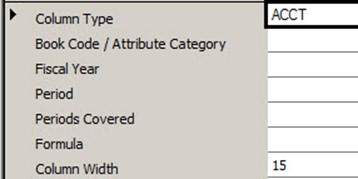
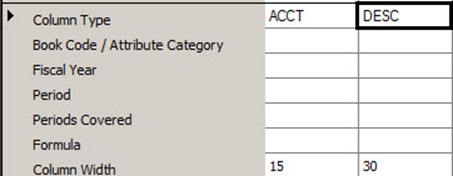
Double-click on the column definition with your name on it. Change the column A type to Acct and you are in business. That is all it takes to display Account codes for rows from the General Ledger for a column. Can we say easeeeee………Notice again no code. While it may seem light to display numerical labels, this would at least require some SQL or X++ in our other reporting tools.
-
For the second column, we need to allow for words that describe the data within the rows. Usually, these names are generated from financial accounts, but honestly, you can write whatever you want in them. So long as they are within the allotted number of characters. Here we have 30 characters(counting commas, spaces, everything).
Double-click on Column B‘s Column Type. Change the type to DESC. Pow!!! You can put in word descriptions of your rows now that will display in the second column of a report. Notice the column width limit of 30 characters.
-
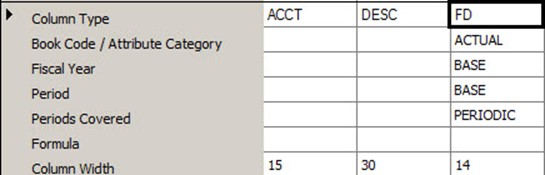
Our third column will contain Month-to-Date actual values. Since our current period is Monthly as set within the source system, this is really easy. Double-click on Column C’s Column Type. Change it to FD and congrats. That is all that is needed to get a month to date calculation. By now, you may start to see an ease of development pattern with Management Reporter that makes it so powerful. A person wouldn’t need to know any code or SQL to do these powerful calculations with this tool.
Underneath the hood, notice what you just did with no code. You just ran a monthly running sum total on groups of rows with no code. That was amazing, but it gets better.
-
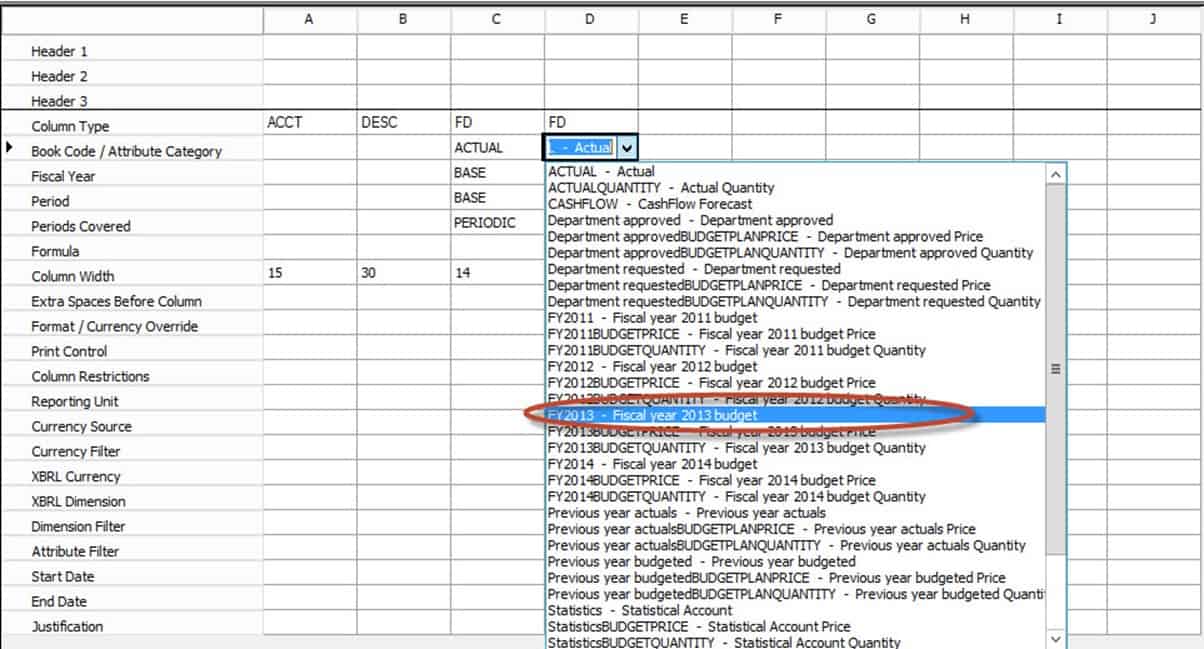
Our fourth column may seem initially challenging. This time, we need to provide month to date information over Budget data. No longer are we relying on the real data from the General Ledger. What are we to do? Easy as 1, 2, 3. Double-click on Column D and change the Column Type to FD. Now, change the Book Code/Attribute Category to FY2013. Whoooaaaa? What is FY2013? This is a name that we assign to our budget. In our budget that we define in the system, we give each account a spending amount of money for the period. The collective accounts with their amounts saved together are known as a Budget. We can exploit this later for an advanced trick with statistical accounts. For now, we have a month to date budget. See picture is step 9 if you want to see a completed view of the values for D.
-
It is time for us to use Variance. In this case, we need to generate our first calculated column. In other words, this column will display data that is the result of a calculation between other columns. Double-click on Column E and change the Column Type to CALC. Calc means that we will put in some sort of custom calculation of our choosing. In the Formula section, give it a simple formula of D – C. That means that this column will display the result of the calculation of the fourth column (D) minus the third column C for each individual row. It is very easy to do formulas with Management Reporter.
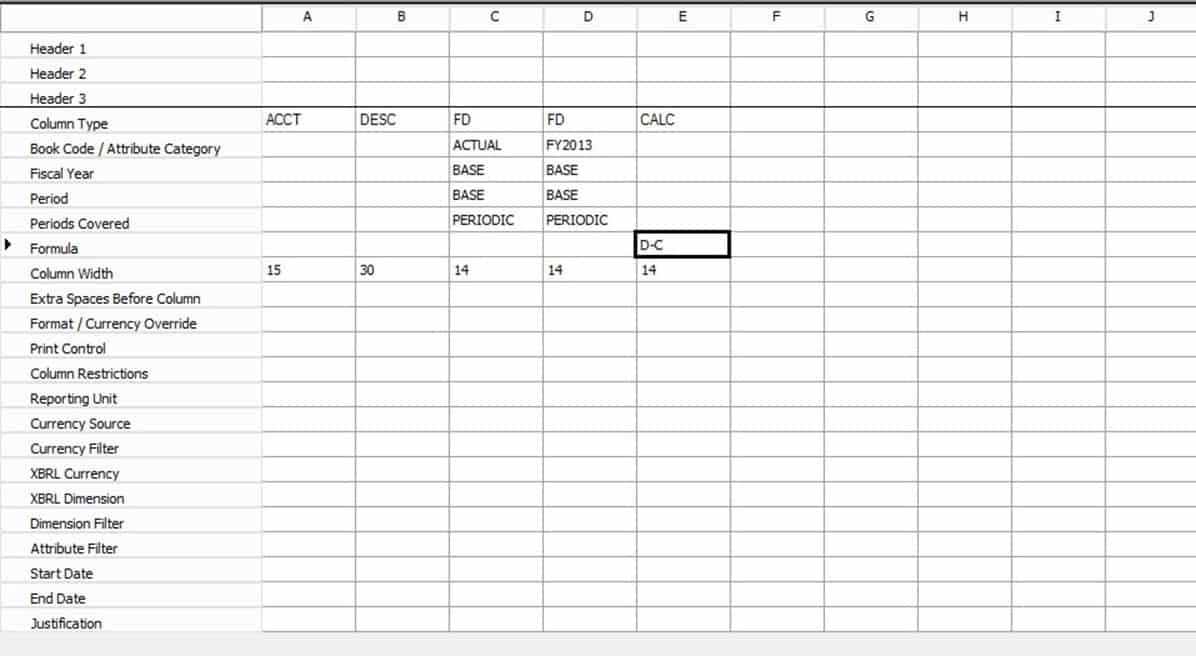
CheckPoint: you have now learned how to do month to date columns, display account codes, run calculations and formulas, and read actual account data as well as budget data.
-
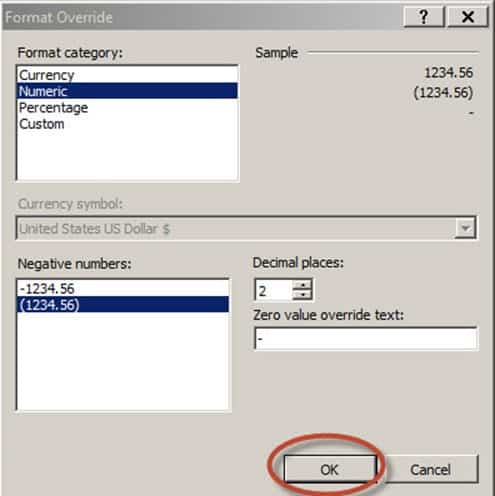
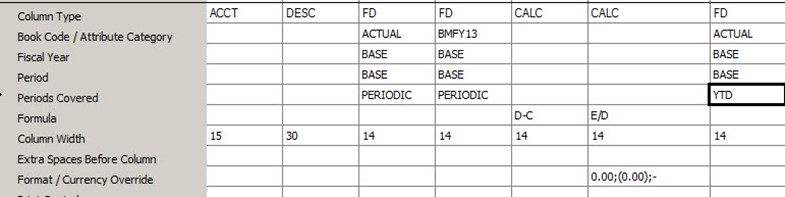
For Column F, we are going to do another calculation, but this time, we will add formatting. Double-click on Column F and change the Column Type to CALC. In the Formula section, enter E/D. Now, click on the format Currency Override column for that cell. Click numeric which will make the format display as numeric. Make sure that the parenthesis are highlighted under Negative numbers so that we will have parenthesis when values are negative. Make sure that Decimal places are two so that we can have a maximum of 2 Decimal places. When the column has no value, give it a default – by going to the Zero value override text and putting in an underscore. Click the OK button when you are finished even though we still aren’t done with that column yet.
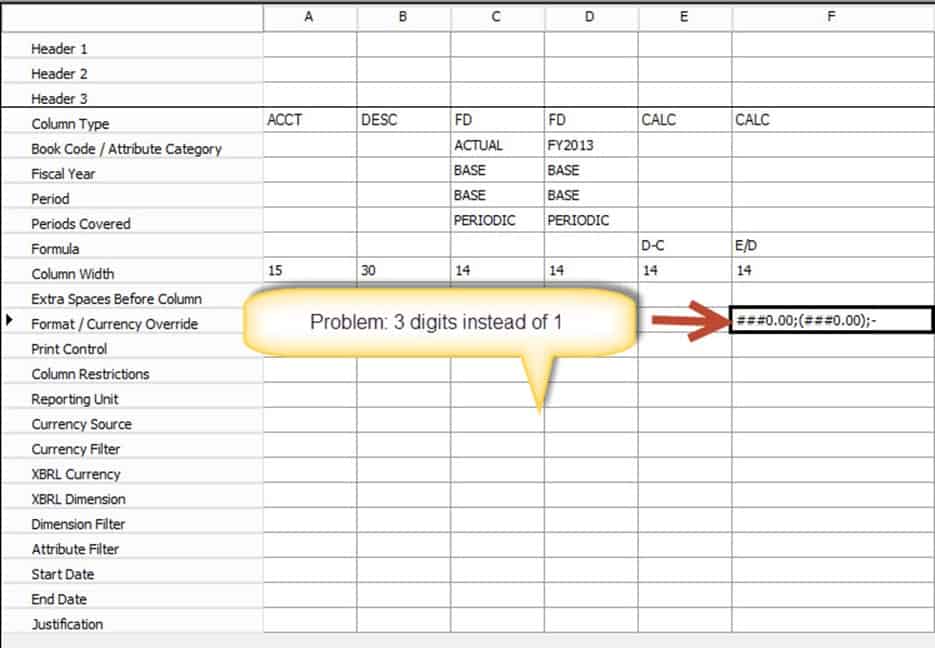
Your column F should look like this at this point:
-
To solve the issue of formatting the numbers before the period, you just need to delete the number signs that you don’t need. So, in this case, Delete the three number signs before the 0.00 for the positive and negative value by
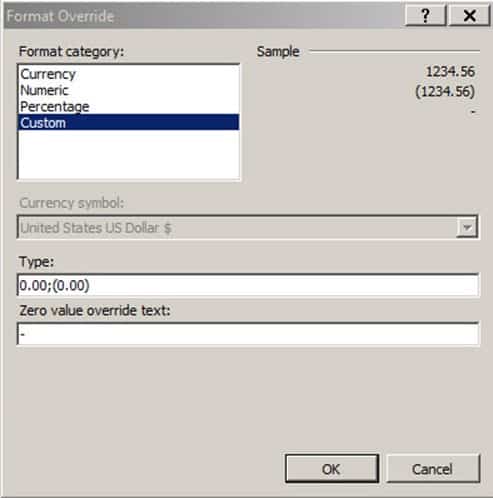
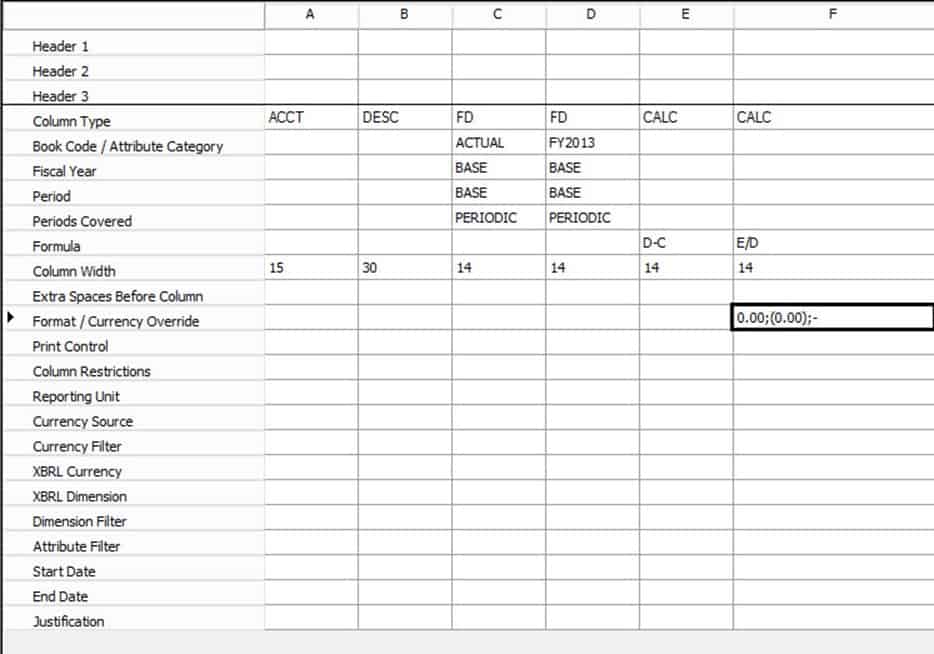
clicking within the Format/Currency Override cell for F and deleting them. Clicking on the Format cell will bring up the little currency dialog box and you can edit it this time. It should look like this at the end before you hit the OK button. At that point, you are finished. You’ve defined a custom format plus a divisional formula. See the two pictures below:
In our first picture, we edit the dialog box to only display one digit before the period.
And the completed pic.
-
Our columns up until this point have been for the Month to Date that we choose to run. We need columns for the Year to Date. So, rather than just sum one date, we need to sum a year. What are we to do? Actually, this is very easy. Double-click on Column G and repeat the steps that you did when you built Column C. Make one slight change, under Periods Covered, choose YTD. That will set your report to do sum up the rows for the year to the end of the current base period ran in the report. That is all there is to YTD in Management Reporter.
-
You will create columns H, I, and J using steps similar to For column H, do everything that you did for Columns D, E, and F except change the Period Covered to YTD for Column D. By the same token, for your remaining two columns (I and J), repeat everything that you did earlier, except change the formulas so that they reflect the new Year to Date columns letters. Make sure that your columns match the screenshot below and that you understand what is happening here.
-
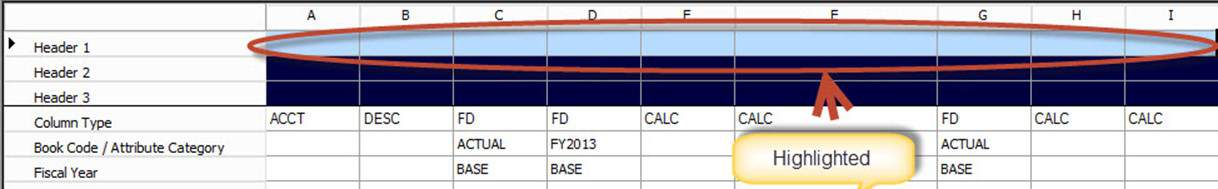
There is one glowing problem, we have not decorated our data with headers and labels. We need to do that. Observe these steps as there is a trick or two included to get you past some headaches later.
First, holding down on the shift key, highlight the range of cells from the Header 1, Column A cell all the way down to the Header 3, Column J cell. You can think of highlighting here in the same way you highlight with
Excel or any spreadsheet program.

-
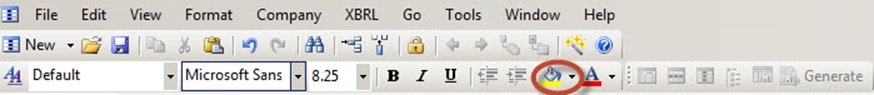
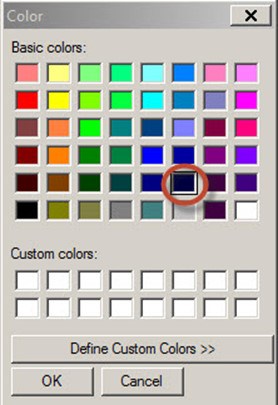
Click the little fill button (shown in first screenshot) to open up the dialog and choose the darkish-blue looking color circled in the second screenshot. Make sure you click OK
to close the dialog after you are finished.
The fill Button:
And here is the color circled
-
Custom Real World Workaround (Brandon’s collapsing lines trick): In the column, Header 1, we want the first row to display as empty. In other words, filled in with blue. Unfortunately, Management reporter won’t let us display any cells that are empty.
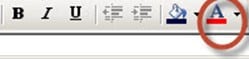
The solution is just to leave none of them open or blank. So, for an empty row, here is what we will do: Highlight Header 1 values A – J. This time, click the Font color button and choose the same darkish blue color that you did in the previous
step.
Here I’ve highlighted rows just like you highlight any spreadsheet rows in a Microsoft office program by holding down shift and moving the cursor.
Change the font exactly like you did in Step 15. What you are doing is giving the font the same color as the background for this row so that the colors appear but people can’t see the text inside of it. If you don’t do this, the empty column cells will not show up properly in the report making things look goofy. Trust me, I’ve designed a few hundred of these – hope you avoid pain from Brandon’s experience.
-
Now, go inside each of the columns and type a single ” .” (period on the keyboard) that you shouldn’t be able to see because it has the same font as the background. Your users won’t be able to see it either, but this will prevent Management
Reporter from collapsing the columns on you when it prints out the report. If you double-click on each cell, you will be able to enter in a single period. Then, just click OK to close the box. Notice that there are other cool options also that I won’t go into in this tutorial series. So, this screenshot, I double-clicked on the cell corresponding to Header 1, column A. I then placed a single period in there and pressed the okay button. I then repeated that for every single column all the way to the end (column I). Please do that.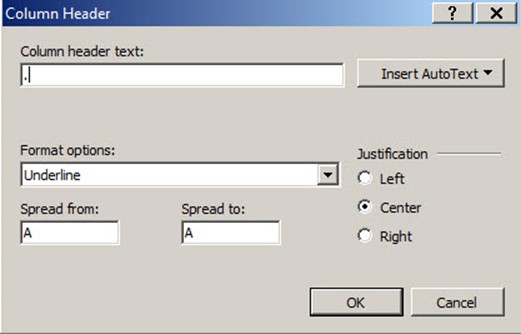
-
Highlight from Row 2A to 3J. This time change the Font color to white for those rows.


-
Now, in column Header 2, column A, double click on the cell and type “Expense” and then click OK.

-
In column Header 2, column B, double click on the cell and type “Account” and then click OK.

-
Oh no, after working from 8AM till 7PM fixing Dynamics AX bugs, Brandon’s eyes and brain seem to be failing. I left out a column. Okay, not a problem for you. For me, it signals that I need to sleep in my uncomfortable hotel bed. Right-click on column E and choose
Insert column. Then, in the newly created column F, give it the dark –bluish fill like the rest of the column headers. Give it a two periods in Header 1 and Header 3. Write the word YTD in White font just like you did for the other cells in the header. When you are finished,
Look at Step 22 for what the header should look like. You will need to do one more thing but that will be on the last step where you fill in the values for the column behavior.

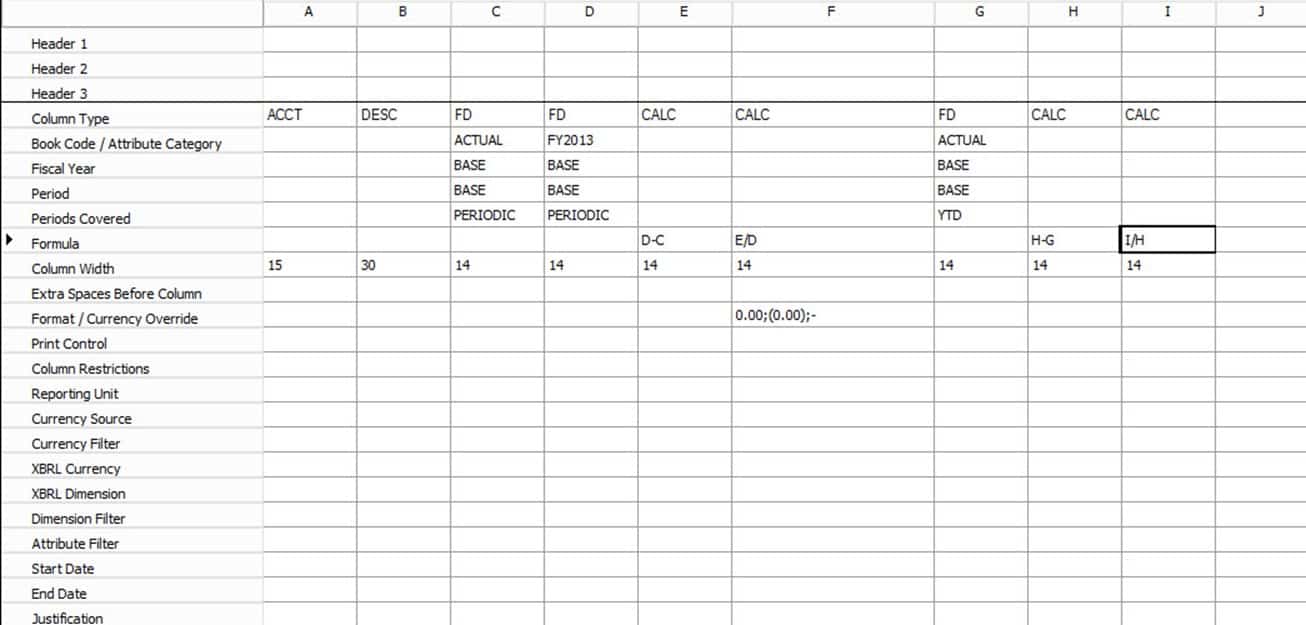
- Repeat those steps, for columns C through J, putting in the following values: MTD, MTD, FAV/(UNFAV), VAR, YTD, YTD, FAV/(UNFAV), VAR. When you are all finished, your column definition should look like the picture below.

-
With the same basic steps, go to Header 3, Column A to Column J, and enter Account, Description, Actual, Actual, Variance, ., Actual, Budget, Variance, .. (There are two
Period values).

-
Now, make sure that you save your changes as you did before. Then, click on Generate and run your report as you did before. You should see some nice formatting from our column definition. Be sure to edit your column Definition so that it looks like
Mine below since I made a mistake by leaving out a column earlier.

-
Finally Save your Column Definition with your name-1 like the picture below

And that concludes Exercise 2.. As a side note, I’d like to thank everyone for the supportive emails. These tutorials take a tremendous amount of time to write and screenshot. And it can be difficult because I never quite know where my current project will take me.
Sometimes I work 40 hour weeks (love it), and sometimes I have to work 70 hour weeks – it really depends on what I need to do to make a project successful. If I ever disappear or am late on a post, trust me, I’m still planning on finishing the series. Trust me, I’m a learning
Fanatic. Till Part 3!!!
A.

