Consulting, Dynamics AX Introduction
Beginning Management Reporter Tutorials Part 3 – Your First Row Definition
 15309
15309 
Dec
Up until this point, we’ve been concerned with the look and feel of the application. Now, we’ll actually change our concern to the data itself. Our new request for data hinges upon adding a new account to the row of data with a row for totaling values as well as
Subtotal and final total line. We will also need to format our row values if needed. Usually, we leave formatting to the column definition unless we have a special case of only a few rows needing formatting or varying formats that are dependent on the inner data within the
Individual rows. In the end, I hope you understand that we have end up with a very intuitive way to define populated data on rows – so structured, that it just makes sense.
[I assume that you are using the Same Dynamics AX 2012 image that I’ve been using since the beginning of the series, but for those of you from other Dynamics Products or without access to the image, simply use 20 expense or cost accounts. The steps are the most important thing to understand here].
To follow this series from the beginning, please visit here:
http://instructorbrandon.com/beginning-management-reporter-tutorial-series/
Let’s get started.
-
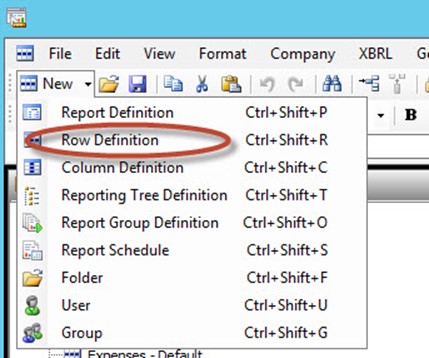
Create a new Row Definition by clicking the New button and choosing the Row Definition Option.
-
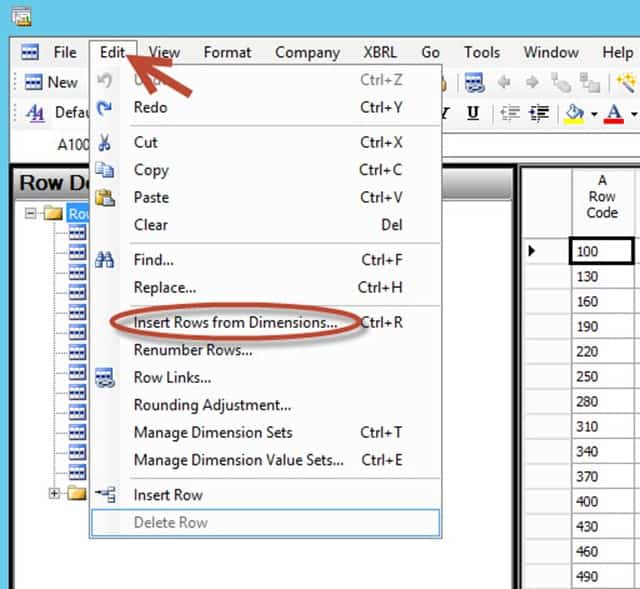
Now, left click on edit and choose Insert Rows from Dimensions. Note: this is a great way to auto-populate your table with data and save yourself a lot of time.
-
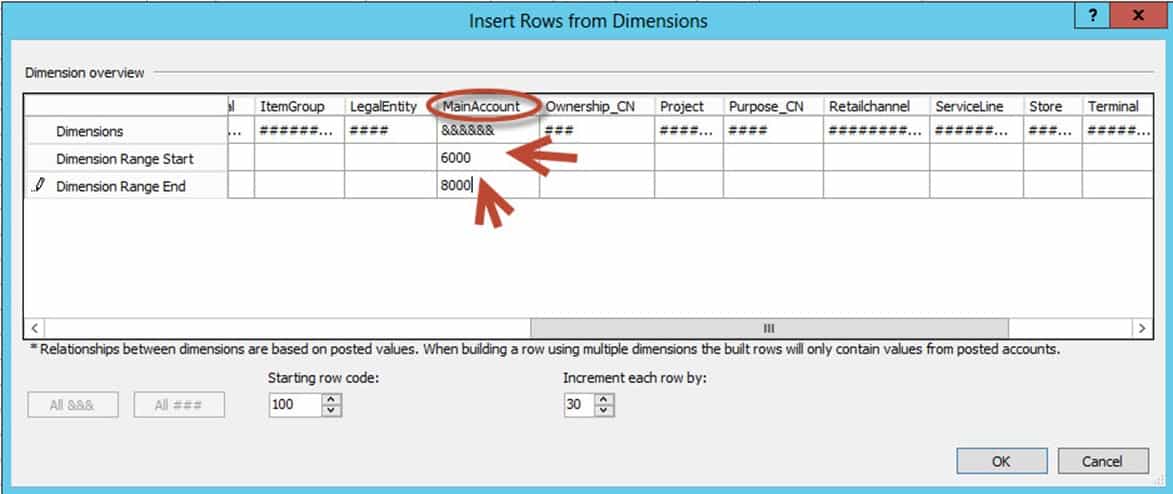
Oh and look at this.. Just look at this. You get this popup, which has all these options. Those are dimensions – they are the way that you describe data in the financial ecosystem. These allow you to group data in an infinite amount of ways. As a BI developer, we do this with cubes. With Management Reporter, you don’t have to worry about implementing a cube in the traditional way that BI developers do. The cube is implemented when you follow proper financial practices – those translate to a good cube! Sweeeeeeeet!!!!!!!!!! Major, Major, Major benefits here – because of all cubes, Financial cubes are the hardest to develop and you don’t have to worry about that if you have Management Reporter. To save time, go to the Main Account dimension and populate it with accounts 6000 to 8000. This will fill the rows of your data with accounts 6000 to 8000 – these are usually expense accounts. Click OK when you are finished to close the dialog.
-
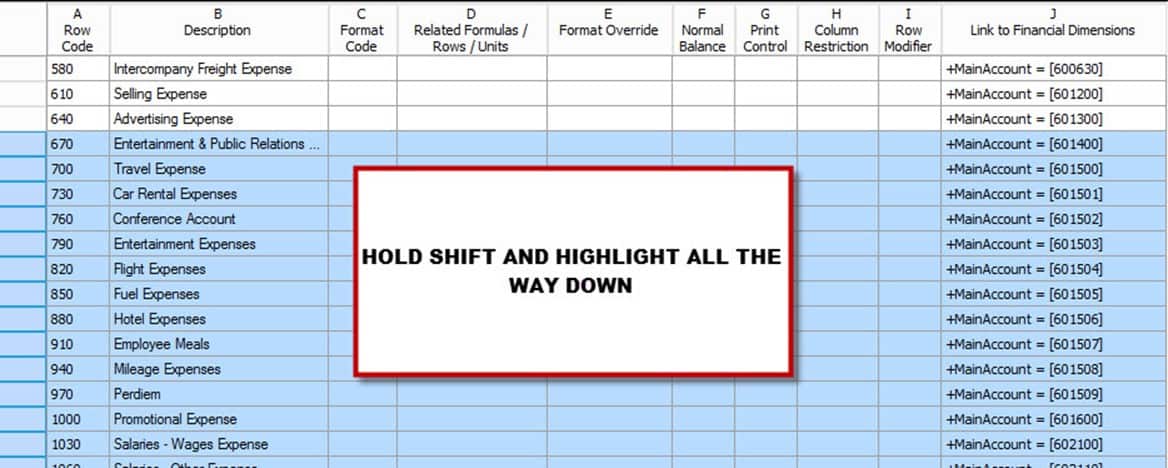
We have some serious financial data!!! But please let’s go further. That is way more than 20 accounts. So, let’s delete some accounts. Just like any other Microsoft Office Program, you will hold Shift to select all the rows from
670 onwards till the end and hit the delete key when they are all selected.
-
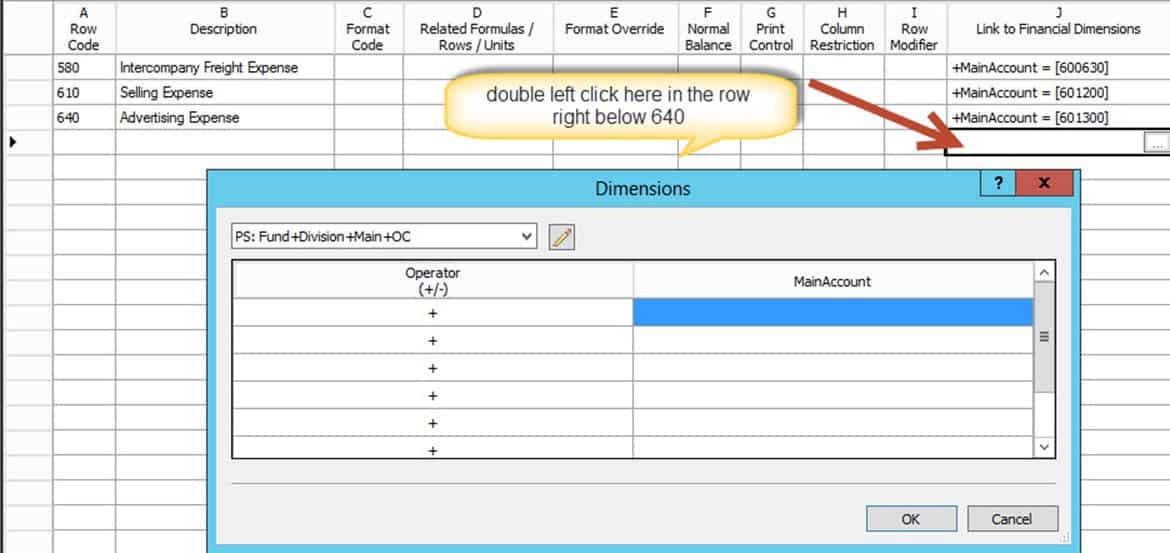
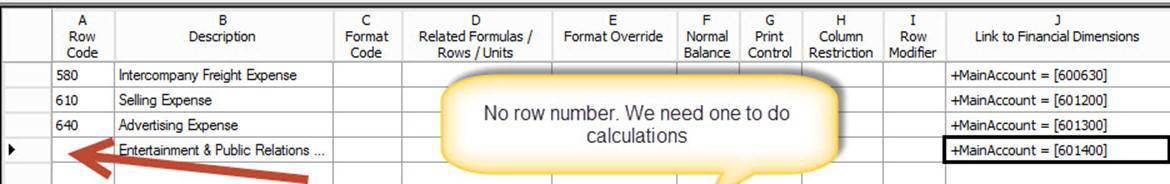
Oooops. I said that we needed 20 accounts but we actually only have 19 (okay, I did that on purpose to also show you how to manually delete an account but the “ooops” part was funny, I hope). No problem, we’ll add an account manually.
In the column, that says Link to Financial Dimensions, double left-click on the row immediately below row 640.
-
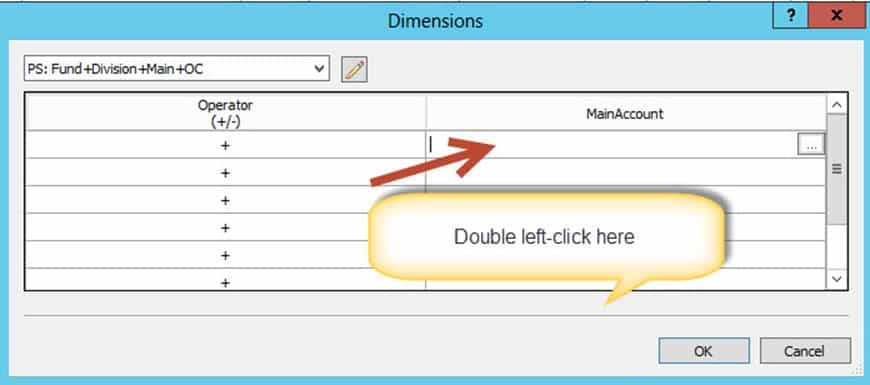
Double left-click with the MainAccount column and choose main account 601400 in the From field. Then press OK on each pop-up menu to close them. Congratulations. You just added accounts in two different ways.

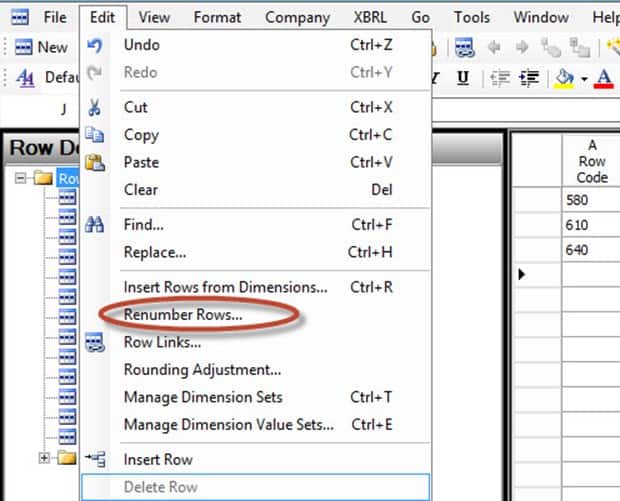
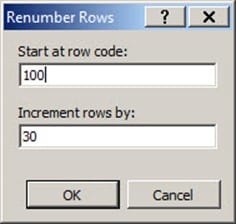
But there is one small problem. The account that was just added doesn’t have a row number. No problem. Click Edit and then Renumber Rows. For our example, enter 100 as the Start at row code and the
Increment rows by 30.
-
Renumber the rows dialog:
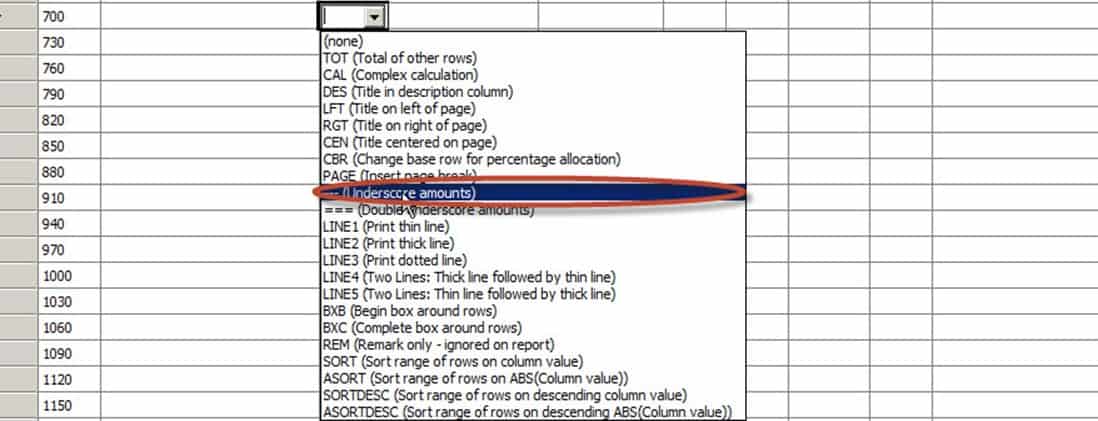
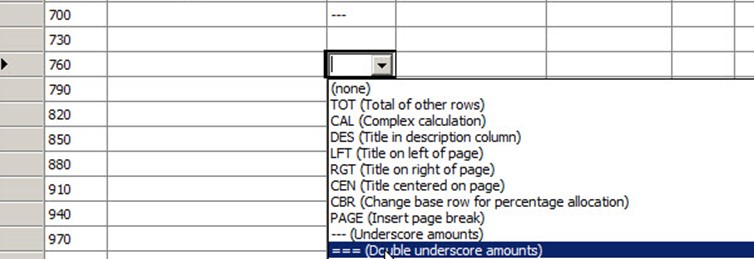
- Now, with financial reporting, formatting is very important. We often need to add lines to indicate totals. Let us add a thin line followed by a heavy line to dictate Subtotal and End. Once again, Management Reporter, makes this easy. Go to Row 700 and click Format Code.
-
And for our thick line, go to Row 760, click Format Code, and choose Double Underscore amounts.
-
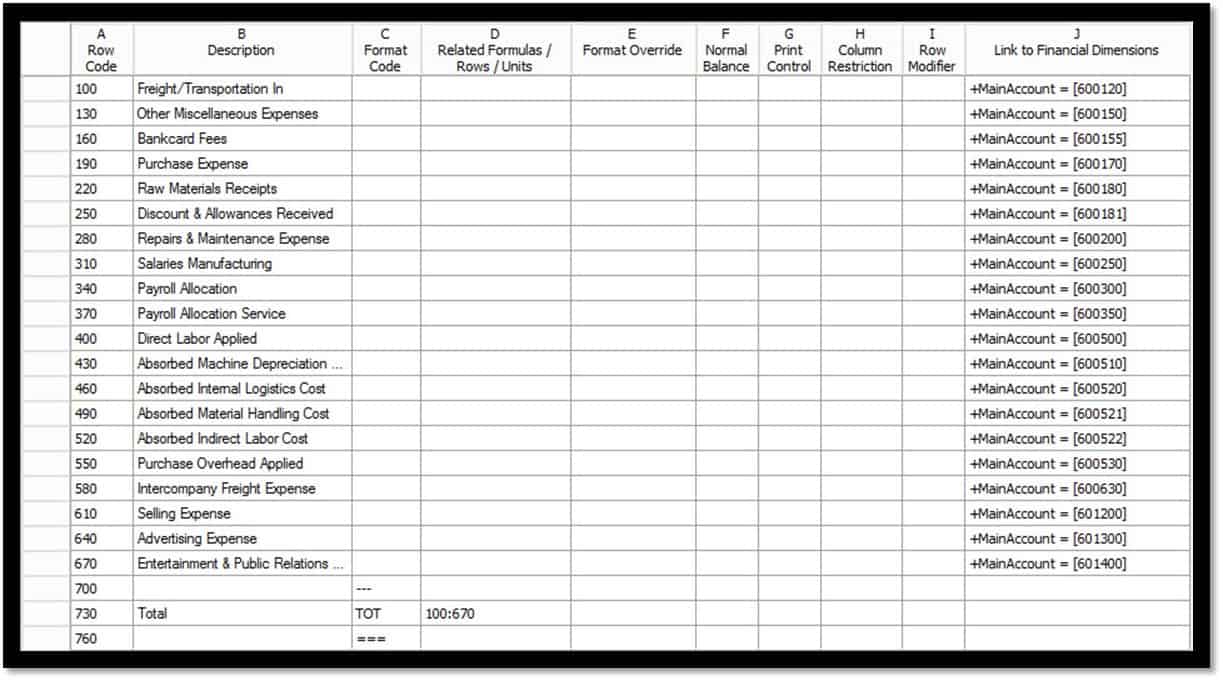
Now, our users have also requested a total row. Go to Row 730 in this case. Type “Total Expenses” in the Description column (column B which just so happens to align with Column B of the column Definition, but it doesn’t have to do so). For the format Code, choose
TOT. Total is a format code that allows for you to add and subtract. It is extremely powerful and simple. In this case, we will tell it to sum up all the rows. We could enter something like (100 + 130 + 160 + 190 + 220 + 250 + 280 + 310 + 340 + 370 + 400 + 430 + 460 + 490 + 520
+ 580 + 610 + 640 + 670). But that would take too long. Instead, go to related rows, and enter 100:670. This says to add the range of rows starting at 100 and ending at 670. Finally, go to Column G(print Control) and double-click on it. Change the format to CS. Finally, as an optional step, you can highlight row 730 and choose bold.
Should look like this.

-
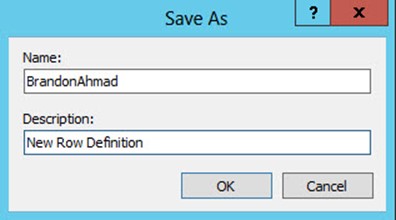
Save the row definition with your first and last name like you did in Exercise 2. Congrats. In the next exercise, we will actually run the report. Prepare to enjoy it. End of Exercise 3.