Dynamics 365 Reporting, Dynamics 365 Tutorials, Dynamics Operations Training, Microsoft Dynamics 365 Developer (F&S) Training Series
D365 Financial Reports Part 1: Tactics to Streamline Financial Data
Financial Reporting with Dynamics 365 Finance & Operations
Business Process Automation | Financial Accounts | Row Definition | Financial Dimensions | Account Analysis
“Automate, simplify, and modernize your worldwide financial processes to enhance operational efficiency as you transition from reactive to proactive operations”.
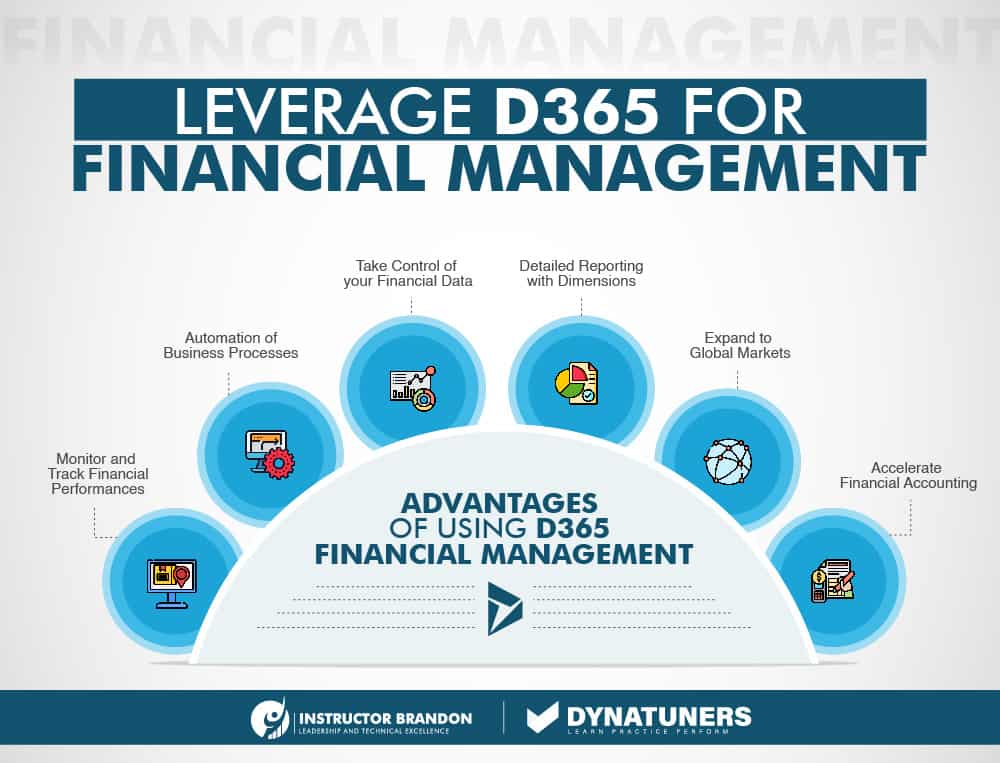
Microsoft Dynamics 365 allows business professionals to easily create, maintain, deploy, and view financial statements whenever needed. From the financial reports list, you can create a new report or modify an existing report. With D365, you can accelerate your financial performance, improve business health with unified financial reports & gain strategic financial decision-making.
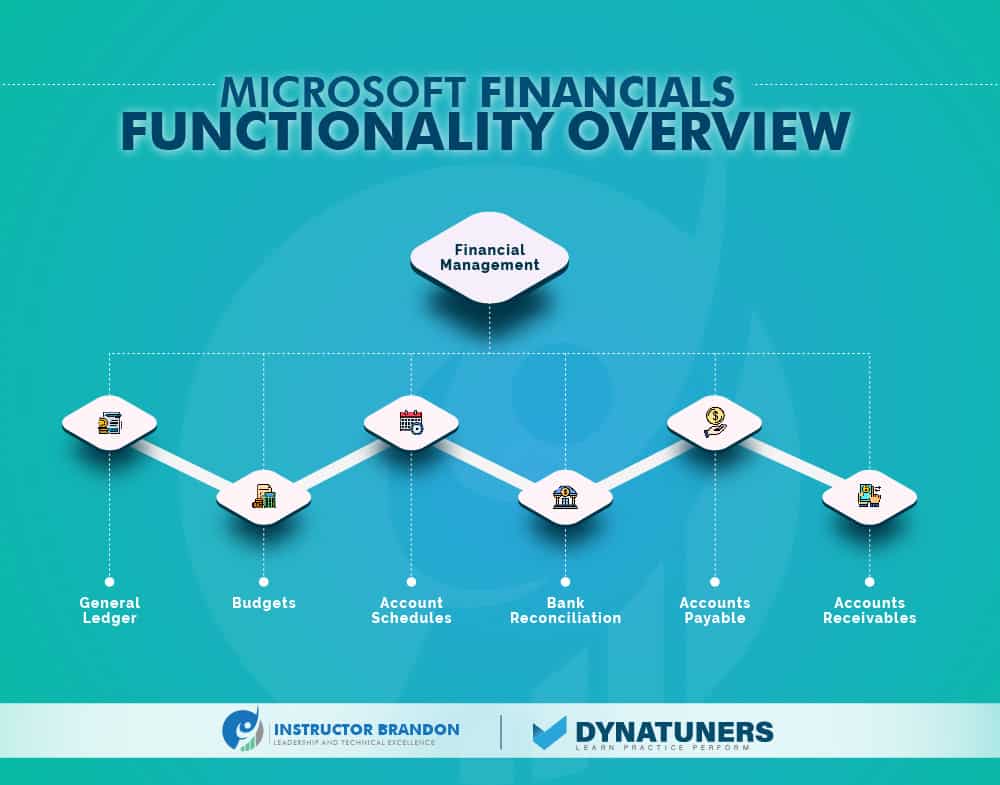
Financial Management
Financial management and accounting are vital for every firm. It plays a crucial role in helping you manage revenue and expenditures, assures compliance, aids in forecasting and budgeting, and gives valuable information to guide corporate choices and strategy. Many firms depend on enterprise resource planning software to manage their finances and accounting effectively. If you want to streamline your accounting procedures, a cloud-based solution like D365 might suit your firm. However, it might be an arduous task for the CFO to manually prepare each financial report, reporting management from ERP software. Therefore, the simplest method to address this issue is to automate the development of a report or collection of reports; Microsoft provides complete freedom to construct report generating schedules based on the desired frequency of report generation.
Financial Reporting
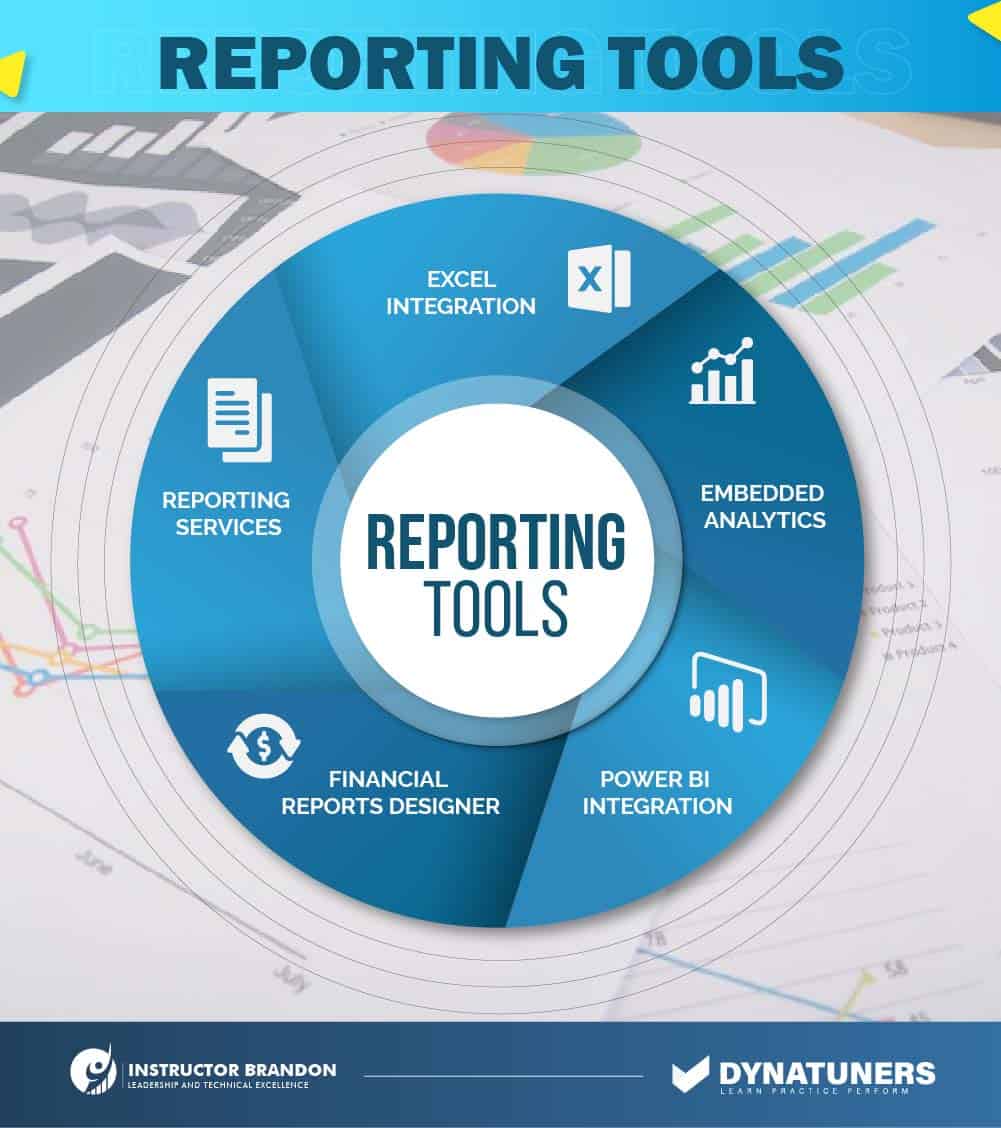
Financial reporting enables financial and business experts to generate, manage, deploy, and examine financial statements. It goes beyond standard reporting limits to let you construct numerous financial reports effectively. Dimension support is a feature of Dynamics 365 for Finance’s financial reporting capabilities, making account segments easily accessible. No other settings or tools are necessary. Key features include flexible report creation, financial report cooperation, and interactive report viewing.
Financial Reporting in Dynamics 365 Finance and Operations is, to put it simply, the easiest. In addition, the regular financial reports included with Dynamics 365 tend to be flexible, resulting in quick problem resolutions. Here, at IB, we provide a comprehensive, user-friendly financial reporting solution explicitly created for Dynamics 365 and YOUR NEEDS.
Financial Reporting Difficulties
We Are Aware of your Financial Reporting Difficulties, Such as IT Dependency for the Development of Custom Reports. Creating ad-hoc reports is time-consuming. Reporting features are poor and inflexible. But with Direct integration into your Dynamics 365 environment, you get the following:
- Independence from IT reliance – allowing YOU and your team to generate reports on demand.
- Instant, one-click access to the most frequently used custom reports.
- Simple ‘Excel-like’ interface for creating real-time reports with comprehensive drill-down capabilities.
- Key performance indicators are immediately accessible.
- One hundred percent assurance in the correctness of your reports.
Report Groups
Report groups are an economical method for generating multiple reports simultaneously. For example, imagine you know that at the end of each month, your users create eight reports. Create a Report group and instead of choosing Produce for each of the eight reports inside the group, pick Generate for the report group to generate all eight reports in a single step. When the reports in the specified report group have been created, you may see the individual reports by navigating to Financial reports (General Ledger > Inquiries and reports > Financial reports).
Using financial reporting, you can create sophisticated, crucial financial reports with ease. Embedded with strong Artificial Intelligence (AI) technology, delivers an easy-to-use spreadsheet-like interface with a direct link to your Chart of Accounts. Get a deeper view into the narrative behind your data with comprehensive drill-down capability. You can rapidly dive into the intricacies that make up any total – no more second-guessing.
Financial Reports Integration
Users are enabled to develop the reports they need when they need them, without any IT support. You can use any Data point, anywhere in your system. You can effortlessly link to any account, statistic, or data point from any record inside your database. Moreover, you can leverage your data to produce real-time, on-demand, comprehensive reports & insights including dates, departments, & line items. You can complete connectivity and integration with all your key accounts:
- General Ledger Accounting (FI-GL) – the cornerstone of FI and financials. In general, delivering the fundamental financial reports such as a Balance Sheet, P&L Statements, or data for VAT Returns.
- Accounts Receivable (FI-AR) – all commercial ties with consumers.
- Asset Accounting (FI-AA, previously known as “Asset Management” FI-AM) – covers the purchase, depreciation, and retirement of fixed assets.
- Accounts Payable (FI-AP) – all financial contacts with suppliers.
- Bank Accounting – processing of bank statements.
- General Ledger Account.
- Profit Center (formerly part of controlling) – an organizational unit inside or across company codes on which GL account balances and transactions may be shown.
- Vendor – a crucial component of FI-AP.
- Customer – essential aspect of FI-AR.
- Fixed Asset – an essential component of FI-AA.

SUMMARY
Financial reporting allows financial and business professionals to create, manage, implement, and analyze financial statements. Dimension support is a component of the financial reporting capabilities of Microsoft Dynamics 365 for Finance. Key capabilities include adaptable report authoring, collaboration on financial reports, and interactive report viewing. Using financial reporting, it is simple to develop comprehensive, vital financial reports. Powered by robust Artificial Intelligence (AI) technology, a spreadsheet-like interface is provided. Users may create the reports they need, when they need them, without IT assistance.
Save Time While Reducing Overall Reporting Costs
Hundreds of Dynamics 365 financial reports you already need are built-in. You need data, and you need it fast. View your GL, AR, AP, Bank, Asset, Funds, and Travel transaction balances in user-friendly customizable reports than can be filtered to what you demand. Business intelligence trends and performance are simplified in our intelligent dashboards. Instantly gain insight into your Key Performance indicators with drill-down functionality and the ability to collaborate within every cell.
Spend your time analyzing your data, not wasting time compiling it. The Dynatuners range includes some of the world’s most advanced Dynamics performance tuning solutions, with several successful deployments. Contact us at if you have any questions.
Time is money. Wasted time is wasted money. For example, consider the time you spend creating, correcting, validating, researching, understanding, & then distributing board-ready financial reports for review and business decisions. Not to mention the additional time required from other departments, especially IT.
Here are some common Financial Reports for Dynamics 365 that may be utilized for a variety of purposes:
- Late Receivables from Customers Financial Report: A crucial report used for cash flow management. It aids in determining the creditworthiness of clients and the quantity and duration of money owing to the firm. This report is a financial controller for the module Sales A/R.
- Vendor Liabilities Aging Financial Report: Assists in calculating the amount and duration of vendor debt. This report is a financial controller for the module Purchasing A/R.
- Statement of Financial Position: Provides insight into the company’s financial health by displaying a summary of the asset, liability, and equity values.
- Trial Balance Financial Report: Compares the balances of various businesses or posting times.
- Income and Expense Financial Statement: Describes the company’s income and losses over a defined time period.

SUMMARY
Hundreds of financial reports are already included in Dynamics 365. View the balances of your GL, AR, AP, Bank, Asset, Funds, and Travel transactions in reports that are user-friendly and fully configurable. The trends and performance of business information are simplified by intelligent dashboards.
Functional Walkthrough of Financial Reporting with D365
Generate a Financial Report
Step 1
Navigate to General ledger > Inquiries and reports > Financial reports.

Step 2
Select a report to generate.

Step 3
Select Generate.

Step 4
Fill in the Report date field.

Step 5
Click OK.

Step 6
You can select to View or Delete the report.

Step 7
To generate a report using Report Designer, open the report definition.

Step 8
Click on the Generate button on the toolbar.

Step 9
The Report Queue Status page will open and indicate the location of your report in the queue.

Report groups
Step 1
In Report Designer, select Report groups.

Step 2
Select the report definitions to include in your report group.

Step 3
Select override company, detail, and date settings from each of the reports included in the group.

Step 4
Set the Company, Period, Year, and Detail level for each report.

Step 5
Save the report group.

SUMMARY
Using the above steps, you will be able to generate financial reports along with report groups.
What Issues Can You Resolve With Financial Reporting in D365?
Effective financial integration involves accurate data, expert project management across all organizations, and adherence to international accounting standards. These are the most common challenges encountered by enterprises.
Insufficient or Erroneous data
Unreliable data is one of the most common challenges organizations confront. This is often the result of manually inputting data across several locations and systems, a tedious process prone to human error. Therefore, you must establish procedures that ensure the accuracy and reliability of all inputted and normalized data.
Failure to automate labor-intensive procedures
Financial consolidation may be incredibly time-consuming, requiring many hours of labor from several departments and organizations. Soon, expenses may pile up! Investing in the appropriate automation of these operations might quickly fix this problem.
Errors attributable to employment of separate reporting tools & systems by organizations
Companies struggle to combine reports from several organizations with vastly different naming conventions and incompatible technology that make inter-company data transmission impossible. To solve this issue, invest in a centralized system that creates a chart of accounts followed by all companies.
Financial reporting for the program enables financial and business experts to generate, update, deploy, and examine financial statements. It pushes beyond standard reporting limits to allow you to construct numerous sorts of reports effectively.
Financial reporting involves dimension support. Therefore, account segments or dimensions are instantly accessible.
Financial Performance
Microsoft Dynamics 365 Finance to help you harness all the capabilities of the system and increase your financial performance, generating various advantages, such as:
- Improved business health with standardized financial reporting
- Better financial controls with in-depth reporting capabilities and incorporated real-time analytics
- Optimized financial flows using predictive insights
- Strategic financial decision-making enabled by AI and Microsoft Power BI workspaces
- Reduced time, cost, and mistakes via process automation
- Enhanced efficiency with integrated technologies such as Microsoft Office 365
- Manage to change regulatory requirements with a no-code configuration technique
- Easily adjust to both local and global financial needs
Data is the heart of the financial service sector; and in the current times, we are producing more data than ever before. However, such astonishing mountains of data are of no use until financial professionals leverage them for advanced analytics. So, this is where the business intelligence (BI) tools come into play. Thanks to Microsoft for introducing Power BI!
Microsoft Power BI
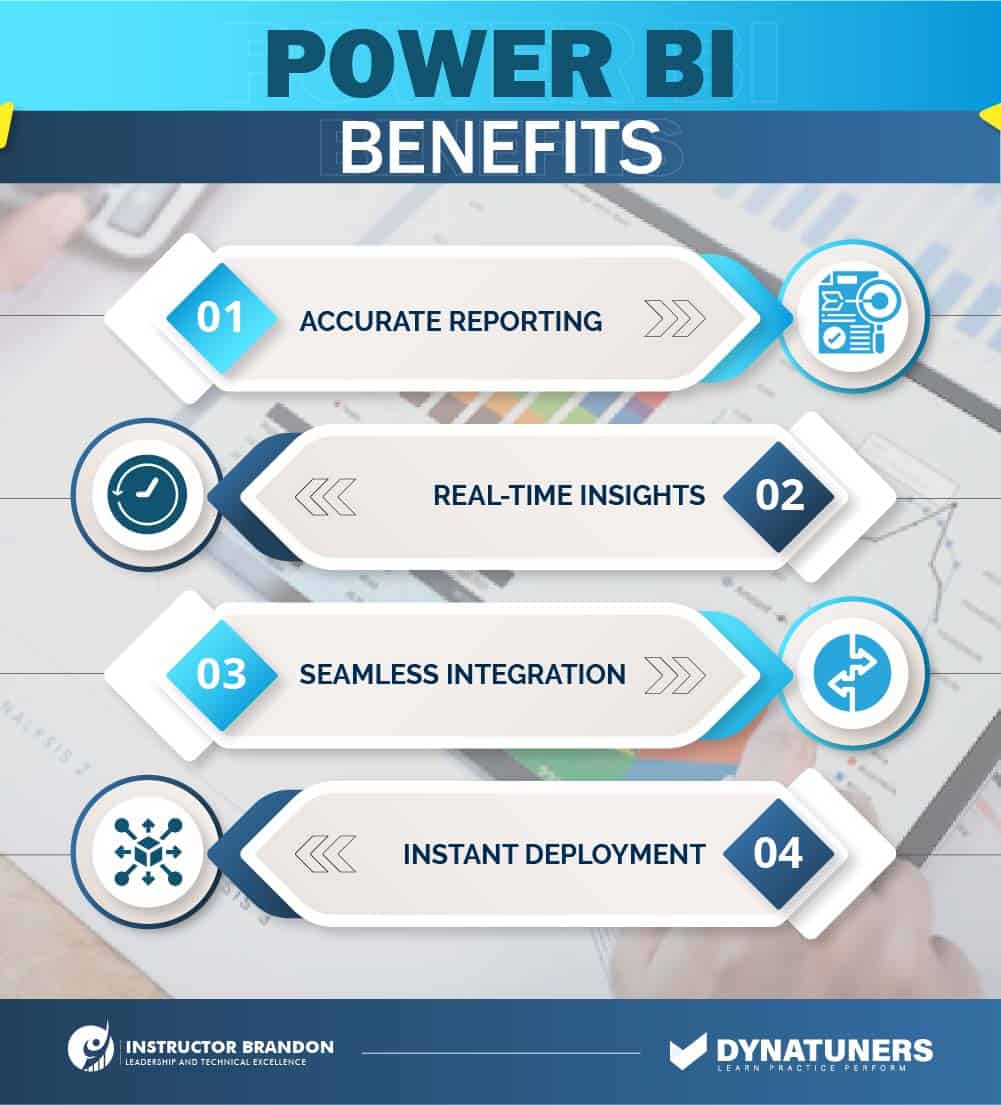
Power BI is an effective BI tool for financial analysts to help them streamline and track their business activities. Amid digitization and the diverse tech transitions, the need for new operational models has driven finance firms to leverage Power BI services. Dynatuners is at your service to provide Help Desk Support during the implementation, upgrade, or migration of your projects with Microsoft Dynamics 365. To get in-touch with us, book an appointment now.

| Sr. |
KPIs for Financial KPI Dashboard |
|
| KPI | Overview | |
| 1. | Payment Error Rate | This indicates the proportion of incoming or outgoing payments that were unable to be processed owing to an error. |
| 2. | Budget Creation Cycle Time | Identifies the time period utilized for budget research, planning, and approval. |
| 3. | Inventory Turnover | Indicates the efficiency with which a corporation sells and replaces its inventory over a certain time period. |
| 4. | Line Items in Budget | The line items in a budget make it easier for managers to monitor expenses in more detail. |
| 5. | Resource Utilization | This measures the efficiency with which a corporation utilizes its resources (time) by comparing billable time against non-billable activity. |
SUMMARY
Effective financial integration requires precise data, professional project management across all enterprises, and compliance with international accounting standards. In the midst of digitalization and other tech transformations, the demand for new operational models has compelled financial companies to use Power BI offerings. Microsoft Dynamics 365 Finance will assist you in maximizing the system’s potential and enhancing your financial performance.
Final Thoughts: Consider Power BI?

The Banking, Financial Services, and Insurance sector (BFSI) industry has always been driven by data, including macroeconomic statistics, financial statements, and balance sheets. Consequently, it becomes challenging for the finance department to collect, analyze, and distribute vast accounting data sets. In order to obtain a deeper knowledge of data, however, financial professionals are searching for sophisticated data analytics solutions like as Power BI. It is an intuitive BI tool for precise data analysis.
Power BI enables financial experts to do tasks beyond data analytics. It allows users to monitor and measure key performance indicators (KPIs), metrics, and charts relating to finance.
You may be wondering how financial institutions monitor their performance or pinpoint the source of the issue. The solution is straightforward: Power BI. It is a fantastic option for financial institutions since it allows them to obtain perspective on significant trends and data. However, Power BI’s applications in the banking industry are many and varied. Consider some crucial financial analysis applications of Microsoft Power BI.
Consolidate enterprise data using Power Query
It is difficult to coordinate and consolidate a big quantity of data from numerous sources. Data aggregation from several sources, such as on-premises servers, Excel sheets, data warehouses, and cloud applications, might put constraints on the data’s complexity, volume, or type. However, in the data-driven financial sector, Power BI enables firms to combine diverse data sets and consolidate files using Power Query without restrictions.
Create visual and graphic reports
The Power View feature of Power BI helps financial professionals to generate interactive visual reports, maps, tables, and charts. It allows users to develop visually appealing representations of existing financial data. Therefore, it may give you with an engaging reporting, exploration, and presenting experience for your data. Power View enables you to create more visually beautiful and presentable informative ad-hoc reports. It will ultimately assist you in making educated, smart business choices.
Identify evolving data trends & patterns
As the volume of data expands, so does the need to analyses and identify shifting data trends and patterns. Therefore, financial professionals must have an intelligent BI tool such as Power BI. The in-built temporal intelligence function of the Power BI dashboard allows users to identify significant data trends and distinct patterns. In addition, it may assist you in identifying changes in data patterns over time, such as variations in profit and loss statements, sales income, company costs, etc.
Visual situations with what-if variables
The financial services industry need vital answers or insights from company data in order to visualize it. Consequently, the Power BI analytics tool has a new “what-if” parameter or analysis method. It allows you to make important choices based on data forecasts or estimates. Thus, it enables you to assess how things might have been different in the past or future if a different scenario had occurred.
Power BI enables many options! The fast expansion of Power BI for financial analytics may provide businesses with more control over their financial operations and a competitive advantage. Contact our specialists if you are considering utilizing Power BI to optimize your financial processes. They will assist you in gaining a deeper and more thorough comprehension of your offerings and consumer replies. To discover more about Power BI, you can also go to our blogs for information on why you should use the tool for business analytics.
SUMMARY
Microsoft Power BI is a user-friendly BI solution that facilitates accurate data analysis. The Power BI analytics tool offers a new “what-if” parameter or technique of analysis. It lets you to evaluate how the past or future may have been different if a different situation had transpired.
At Instructor Brandon | Dynatuners, we always seek innovative methods to improve your competitiveness and suit your Microsoft Dynamics 365 requirements. Our offerings are founded on defined procedures, industry experience, and product understanding. If you’re interested in consulting with our specialists on how we can help you manage your financials perfectly, don’t hesitate to Contact Us.
What use does financial reporting serve in D365?
Financial reporting enables business and finance professionals to produce, modify, deploy, and examine financial statements. It goes beyond standard reporting limits to assist in the efficient creation of several report kinds. Dimensional support is included in financial reporting.
What is the role of financial reporting teams?
Financial Reporting organizes the creation of quarterly financial statements, numerous financial studies, regulatory filings, and surveys, as well as the yearly external audit of the financial accounts.
What do month-end financial reports consist of?
The month-end report accounts for monthly transactions in the ledger. This involves documenting loan payments, depreciating firm assets, writing off bad debts, and entering entries for prepaid costs.

 4287
4287 

