Consulting, Microsoft Dynamics AX
How to Troubleshoot Enterprise Portal Performance in Dynamics AX 2012R2 with Tracing: a time tested method
 14595
14595 
Mar
Few methods within the performance troubleshooting world have withstood the test of time, but when it comes to finding problems, nothing beats IIS tracing. Sometimes, Enterprise Portal and our Services are just slow. And sometimes, we have nothing in the logs to really help us out. This post is me giving away one of my cherished methods of troubleshooting for finding these problems.
Recently, I was at a site location and asked to help troubleshoot an Enterprise Portal issue. One of the most helpful things that you can do is enable tracing and read the trace logs. For those of you just starting your journey in Dynamics, tracing allows for us to see the lower level events happening under the hood. It will often produce very helpful error messages. I was reading through the Enterprise documentation and noticed that some of the steps had been left out as the assumption was that the Event log would pick up all artifacts if you enable a trace.
However, in my experience, I haven’t found this to be the case. So, I often implement my own traces. This blog posting covers how to do it with IIS 7.0. For my past students, this isn’t in any courseware at this time, but that doesn’t mean that I won’t teach it to you. J
In order to do this exercise, you need the free Dynamics AX 2012R2 sample image that is available from Partner Source. (the methods, however, follow any IIS 7.0 installation)
Part 1: This section can be found in the standard Microsoft documentation if you google “Troubleshooting Enterprise Portal Performance.” It’s part 2 that I am excited about.
- Go to C:inetpubwwwrootwssVirtualDirectoriesdynamicsax.contoso.com80
- Right click the Web.Config file and open it with Notepad
-
Now, do an Edit à Find for the term “compilation”. Change the element like this: <compilation batch=”false” debug=”true”>. Save the file and go about your business. Or Read More for an undocumented approach to doing this in the Dynamics world(as of this date).
Part 2: (not in the standard documentation). That’s great, but let’s do one more thing in case our event log acts up and doesn’t show us everything. Plus, we need to take more control of our logs as there are certain key events that we need to see. This will also work for troubleshooting AIF performance also.
- Open up Start->Administrative Tools à IIS Manager
-
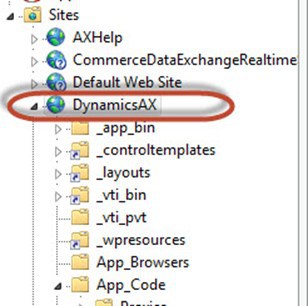
Click on the site where you have Enterprise Portal installed under sites.
-
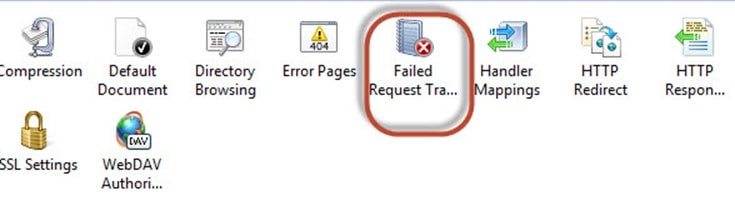
Double-click on Failed Request Tracing to open it up.
-
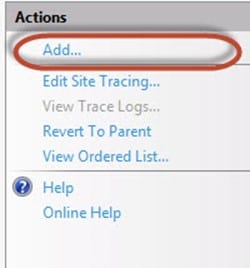
Now, under the Actions pane, click Add
-
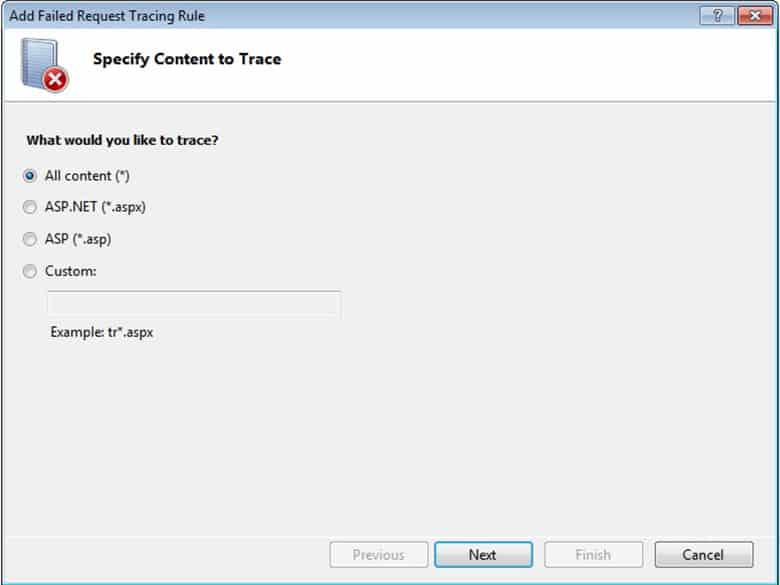
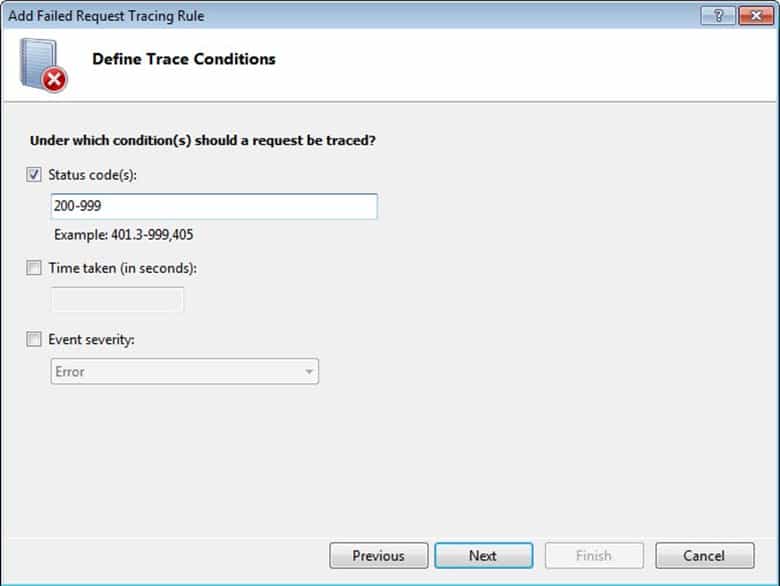
Leave all the defaults to capture everything and click Next. We really are doing some “fishing” here in that we are looking at all angles to find the problem.
-
Now, you can Google “Http Status Codes” to see which ones you want to trace (important for doing long-term traces), but we are going to do them all here. So enter 200-999 as in the screenshot. Notice the Time taken which captures traces after web events exceed a certain time(super, super helpful for troubleshooting performance). Also, notice the Event Severity, which allows you to focus on the meaningful stuff. We’ll leave those alone. We are capturing everything. Click next when you are finished.
-
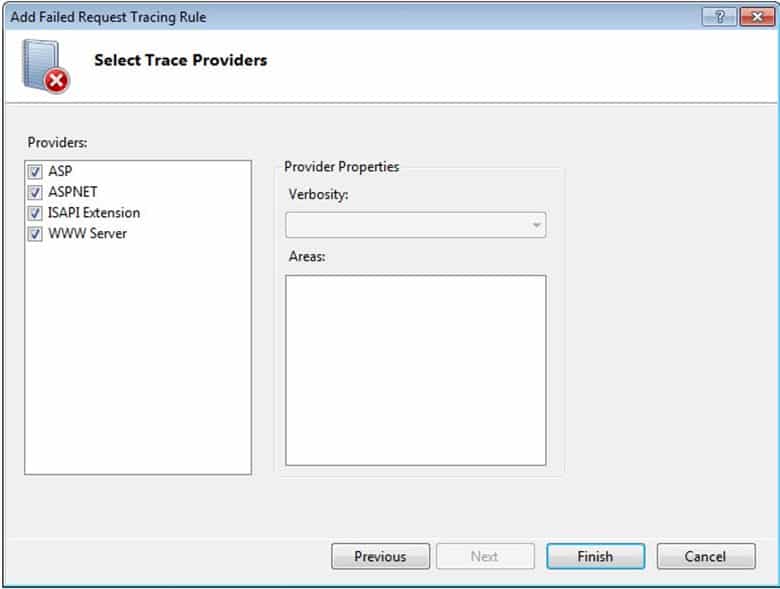
Notice the trace providers. This is very helpful also as we can add trace providers to IIS for tracing different applications. Leave all of these checked also and click Finish.
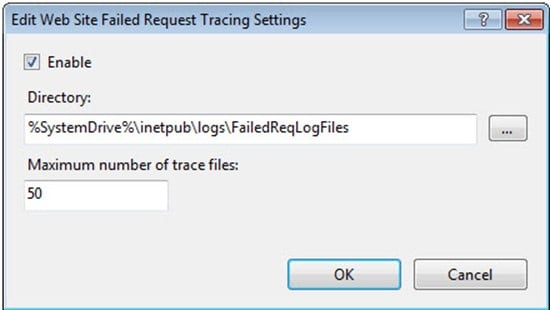
Trace files can get really big, so you probably want to store them somewhere other than the C drive with lots of space and good write performance.
-
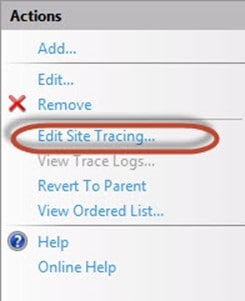
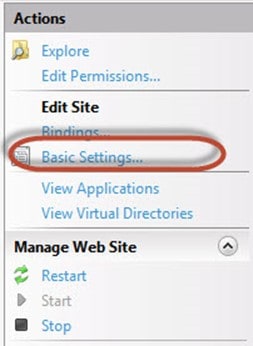
Click on Edit Site Tracing in the Actions
-
Skip this step on the virtual machine, but do it in real life. Under Directory, change the location to a place with plenty of storage and good write performance and press OK. You can also change the number of files, which will be essential to record long term traces.
I’m not a networking/infrastructure person, but I was under the understanding that you don’t have to restart IIS 7.0 to make it take configuration changes. However, there could be some wacky Dynamics functionality that requires it. So, just to be on the safe side, let’s recycle it.
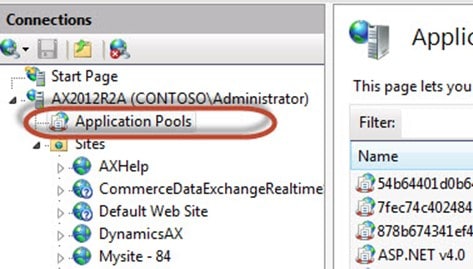
- First, let’s make sure that we locate the App Pool that needs recycling. Under sites in the Connections pane in IIS, go to Dynamics AX (like we did earlier).
-
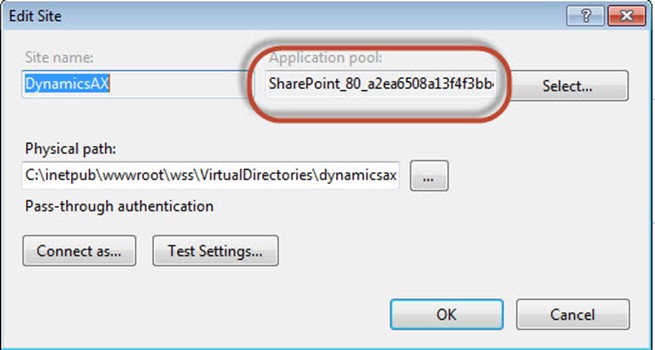
In the Actions Pane, double click on Basic Settings.
-
Then, take note of the application pool: (Note: this is a great area for troubleshooting authentication problems, but that is beyond the subject matter in this tutorial).
-
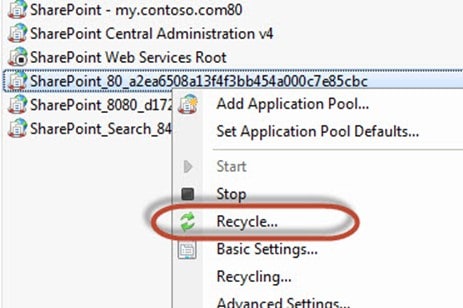
Now, go back to the Connections pane and click on Application Pools. Find your Application Pool and right click on it. Then click on the recycle button. Remember NOT to do this why you are busy. Do this during low volume hours.
Part 3: Viewing and Analyzing the Traces: Now, you need a way to look at your IIS logs. This can be done in multiple ways, and there is no right method. Note: I do not guarantee this working on your machine as your configurations may be different for your environment. If so, stop right here at the post. Otherwise keep on. All of these traces can be viewed in Internet Explorer by simply browsing to your trace folder. Right clicking on them and opening them with Internet Explorer. Note: you may have to add the trace site to the trusted internet zone. Plenty on that with Google tutorials.
-
Browse to the folder where the trace logs were configured. You should notice that they are located at: CàInetpubàlogsàFailedReqLogFiles if you didn’t change the log location. You’ll need to keep double-clicking in the folders until you get to the root trace files.
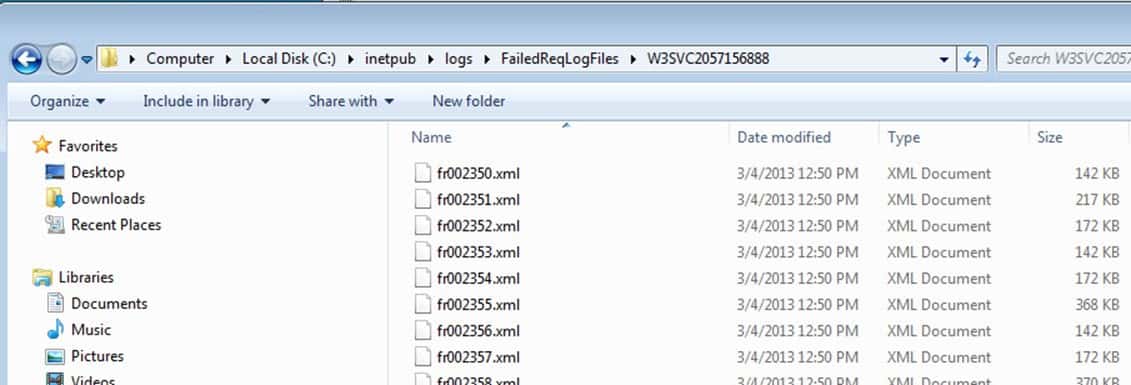
- One xml file is generated per a request but this is ugly and organized. Surely, there is an easier way where we can just look at the requests that took too long or acted up. Of course there is an easier way. I personally like to download Thomad’s IIS 7.0 Trace File Viewer. Thomad is awesome and deserved to enter sainthood for having written this. You can find it. As always, please test in development before running this on your production server: http://www.iis.net/downloads/community/2008/03/iis-70-trace-viewer. You can download the tool. Extract it to your desktop and then click on the traceviewInstall.exe tool to install it. Remember to snapshot your virtual development machine first, so you can rollback any changes that you don’t like.
-
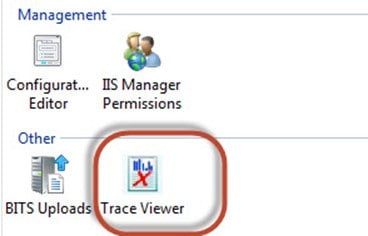
Now, open up IIS manager and click on the site where you set up the trace. Look in the Modules view in a category called “other”, and choose Trace Viewer. Double-click on it and get ready to experience the meaning of “awesome.”
-
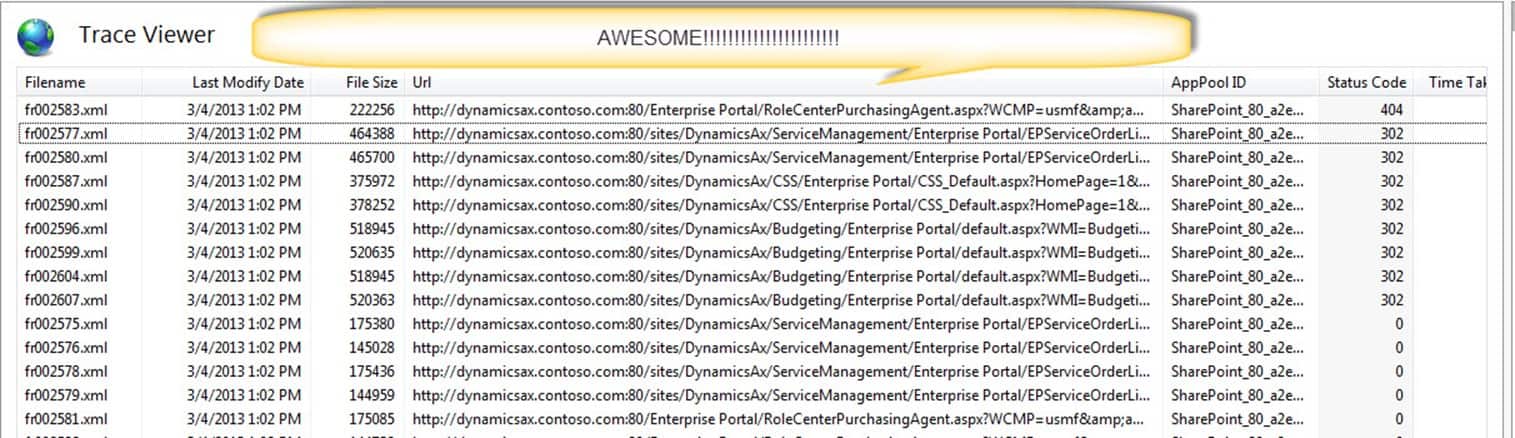
Notice here that all of the trace files are listed, but we have something a lot better. We can see the Status Code of the trace and the time taken in a friendly list view. We can also easily sort by time taken. So, we can find our worst offenders affecting performance(or generating errors) quite quickly. We can also see the URL which shows us exactly where the user was when the application started “cutting” up (I realize that some of you may not use English as a first language, so think of “cutting up” as the application malfunctioning).
-
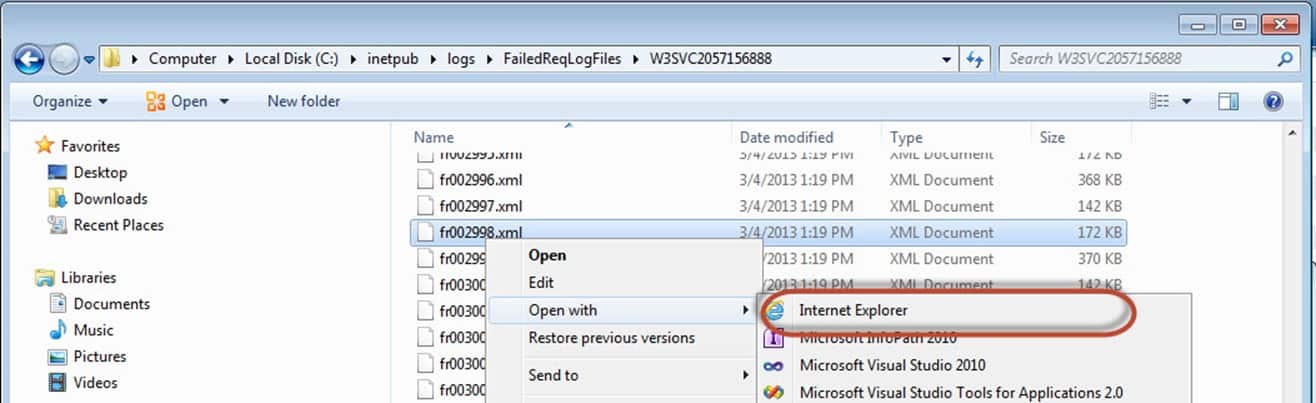
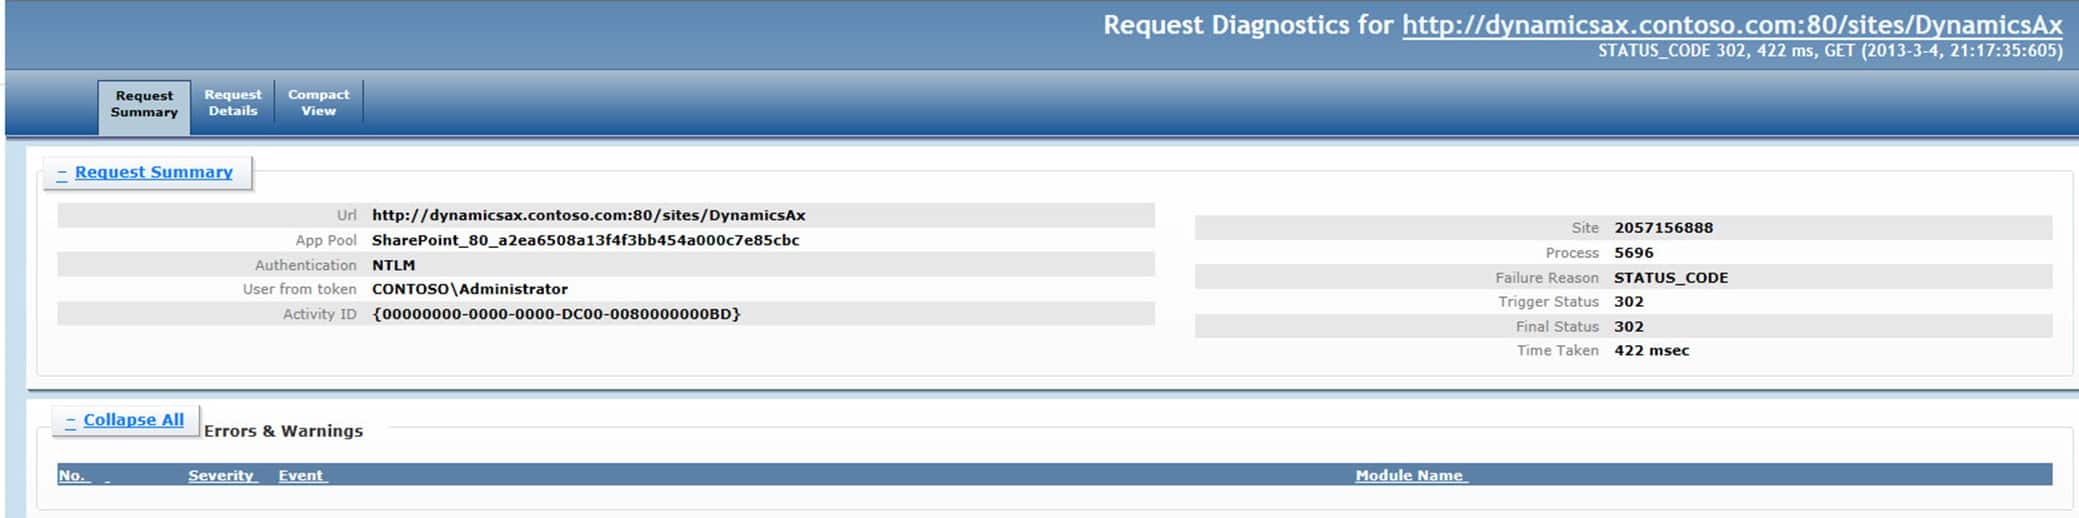
Finally, let’s look at the second 302 error and do some analysis on it. For example, let’s look at the request that maps back to “fr002948.xml(not shown in the screenshot, but trust me, it is there).” We now browse back to our IIS directory with our file name in hand. Right-click on the trace and open it with internet explorer.
-
And look at our nice friendly screen. We can see the time that a request took.. The messages associated with it. We can even see the user who performed the request if we don’t have anonymous authentication enabled (helpful for tracing who did what). We can also see a failure code and we can drill down into other details which tell us more. Trust me, this will make your life easier.
And so that concludes our series on how to setup an IIS trace to find problems. “But wait Brandon”, you might ask. Wouldn’t this work for solving any IIS based process à SSRS, SharePoint, WCF, AIF, Dynamics NAV, Dynamics AX, .NET MVC, Dynamics CRM, ect? Yes, it is a time tested method that has been around forever. But my blog is a Dynamics AX blog and Microsoft Learning blog. And for those who take me in other courses, this instructor still has a lot to give you that isn’t in any courseware. My 80 hour a week working self is making all kinds of enhancements to Official Microsoft courseware based on my learnings from consulting assignments.
I would like to thank the group last week who pushed me to update this process. You all were absolutely amazing and wonderful and have a very intelligent development group. This post is dedicated to you who made my week so wonderful.
Oh, and forgive the late posts. I’m a little backed up.
