Consulting, Dynamics AX Introduction
Tutorial: Developing Reports with Dynamics AX and SSRS Part 1
 17394
17394 
May
Dynamics AX is absolutely amazing when it comes to reporting. However, there are many misconceptions. In this series, we will learn how to write reports in Dynamics AX. We’ll dispel many of the myths and see the advantages to the Dynamics AX way of reporting. We start by writing a report the old way. The old way, while containing many nice things, will be deprecated one day. However, it is very helpful for gaining a feel of what we try to achieve when we use the Dynamics AX reporting framework. The Ease of Use and Simplification themes through templates and graphical drag-and-drop are still there. Many of the self-service, reporting features have no equivalent in the non-Dynamics SSRS version. In the first part of this series, you will learn how to use the Report Wizard to generate parameterized reports on demand. The Report Wizard is amazing. It involves no code and gives you an amazing bit of flexibility.
For this tutorial, you will need to the free Dynamics AX 2012R2 image on PartnerSource. Remember that in order to gain the full benefit of this tutorial, you will need to do the labs. Here we are developing reports in 2012r2, the 2009 and before way.
-
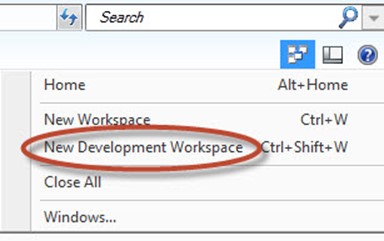
Make sure that you enter the development environment by opening up the New Development Workspace.
-
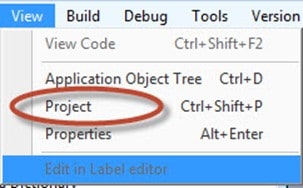
Once the development window is open, we’ll need to open up the Project Window. Note: we open the project window for development. We can isolate our files in a project so that we can compile them separately and focus just on those items that we need for development.
-
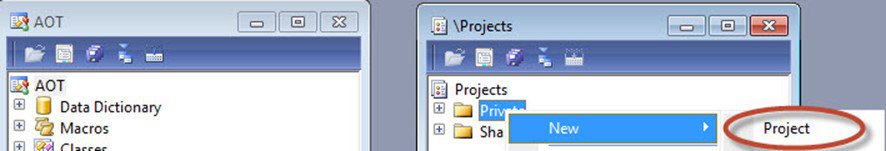
Now, we’ll need to open a new project. We will make this a private project which means that only we can use it. No one else can use a “private” project except you. When we create a “shared” project, others can use it. Right-click on the Private folder, move your mouse over New and select Project.
-
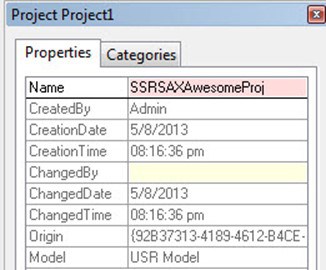
Right-Click on Project1 and select Properties. In the Properties window, find the Name property and change it to SSRSAXAwesomeProj and press the enter key to commit the value in the properties box (you’ll know the box is committed when it the cursor is no longer blinking
In the Name window.
-
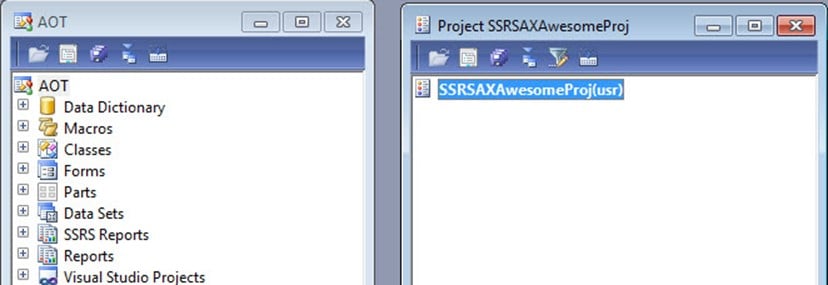
Right-Click on SSRSAXAwesomeProj, and click on Open. Drag the window over to the right of the AOT Development window so that we can drag and drop from the AOT window to the project window.
-
Right-Click on SSRSAXAwesomeProj, go to New à
Report à Report. Note, this will be the project that we will be using throughout the series. We will build several reports, culminating with a Mega-Dashboard report at the end!! So, don’t delete the project after this post.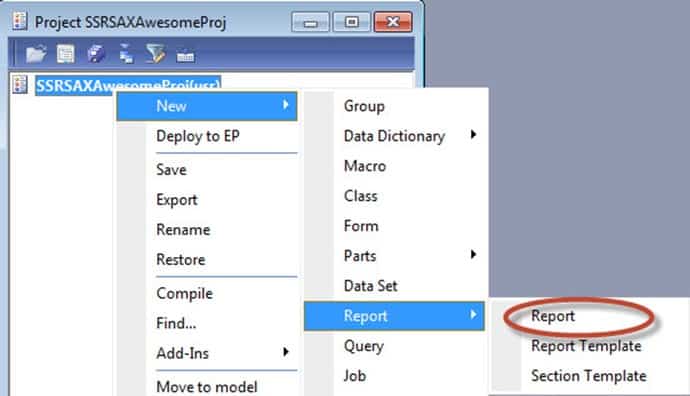
-
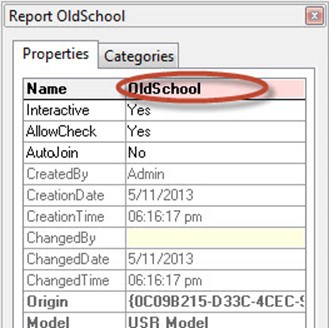
Right-click on the report, called Report1, and choose Properties. Go to the Name property and change it to OldSchool. The reason why we do this here is that because in order to use the Report Wizard we must have an existing report already setup. Even if we just have a blank report like here.
-
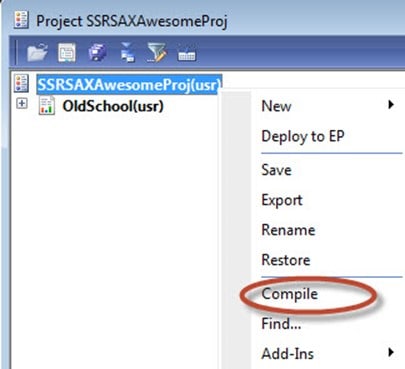
Right-Click on the SSRSAXAwesomeProj and click on Compile. Note, one advantage to compiling a project is that you only compile that project individually. This prevents you from accidentally hitting compile and going into a full compile which can take hours to process! Thank goodness for the project compile.
-
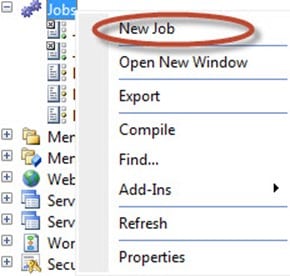
Note: Sometimes, the dynamics ax client on the 2012 sample image acts funny and the table browser or auto-reporting features will show no data. Unfortunately, this was one of the disadvantages of the old way of reporting. Since reports were ran on a client, they were privy to all kinds of problems related to specific client machines. So, you could troubleshoot a report that ran on 300 client computers but didn’t run on one computer. You would have to figure out what was going on that one machine. Forget doing that here. There is an easy fix for the irritation of the client development environment (AOT) not loading data. Create a job and manually call a select query to force communication with SQL Server. We will do that here.
In the AOT, right-click on JOBS and left-click on New Job:
-
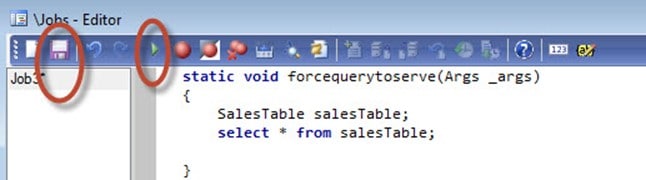
Make sure that your job looks like this and click the green arrow to run it. Remember, this is just a little fix for when the client doesn’t communicate with the server with the job. The title of the job doesn’t matter. Just the select statement.
-
Now, get ready for some Excellence. Click Tools à
Wizards à Report Wizard. This starts the ultra-powerful, but little used Report Wizard.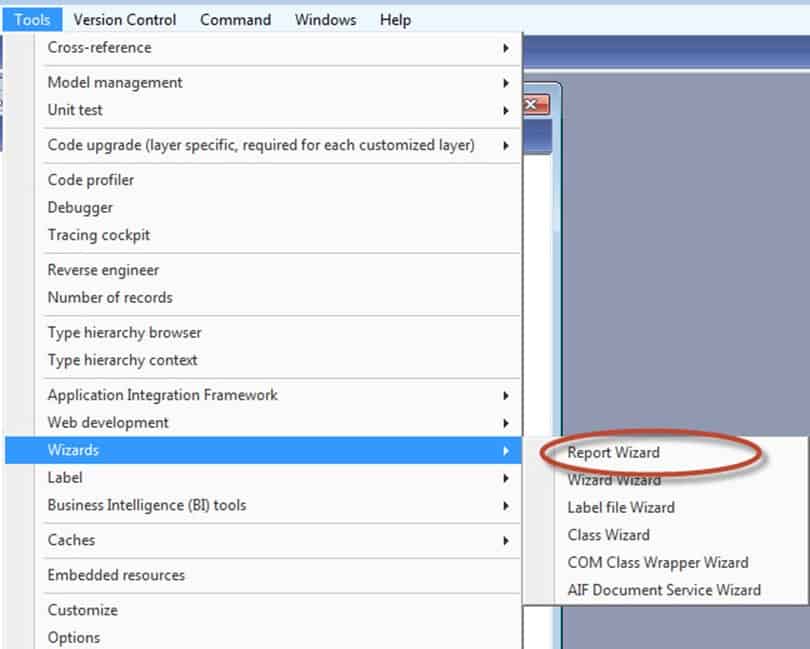
-
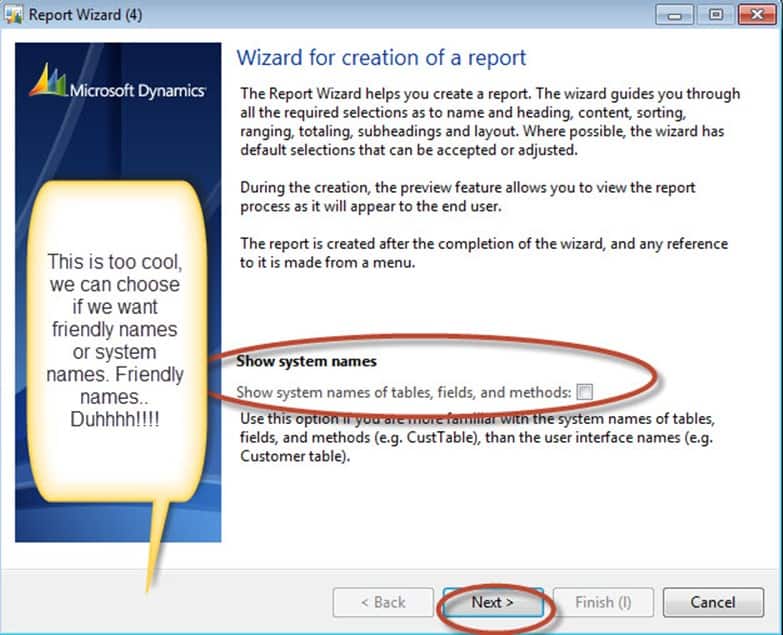
Now, click on Next. Notice that the first page in the wizard has an option called Show system names. There is no equivalent to this in SSRS report builder!!!! This will show friendly, human-made names for tables and columns rather than those complicated programming names often used in underlying databases. This rocks when it comes to self-service business intelligence and reporting because it makes it much easier to figure out which tables and columns you need to pull.
If you are a developer wishing to learn more then it may be wise to check out our Boot Camp, which takes you from zero to hero with some serious hands-on lab action.
-
Now, in the Name, enter OldSchool. Note: although this is not stated in the documentation, in order for this to work, you must have an existing report created and you have to reference it by the “name” that you gave it in the “name” property. For Caption, change the property to: This is an
Old School MorphX Report. Click Next to finish. Note, the caption is what our users see as a title when they try and print the report. It’s important.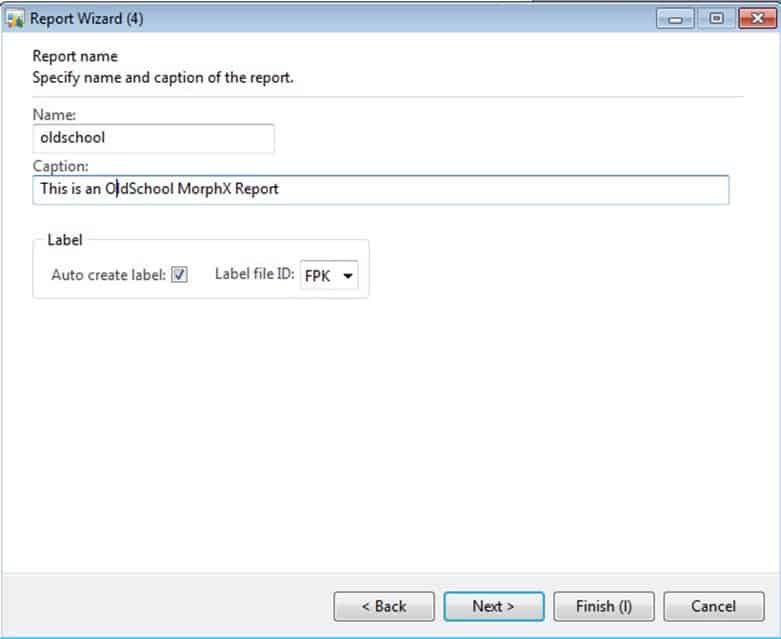
-
Now, we began to see the roots or fundamentals of reporting in MorphX. See, there are several situations where ERP reporting demands requirements that would be very difficult to implement in traditional reporting. For example getting things to layout like the interface, or match common ERP layouts like invoices, or having dynamic parameters. Plus, being able to respect the security structure, ect.. But what really makes the interface work is saving time.. It does many things that the regular reporting framework does not do or would require a great amount of customization to do.
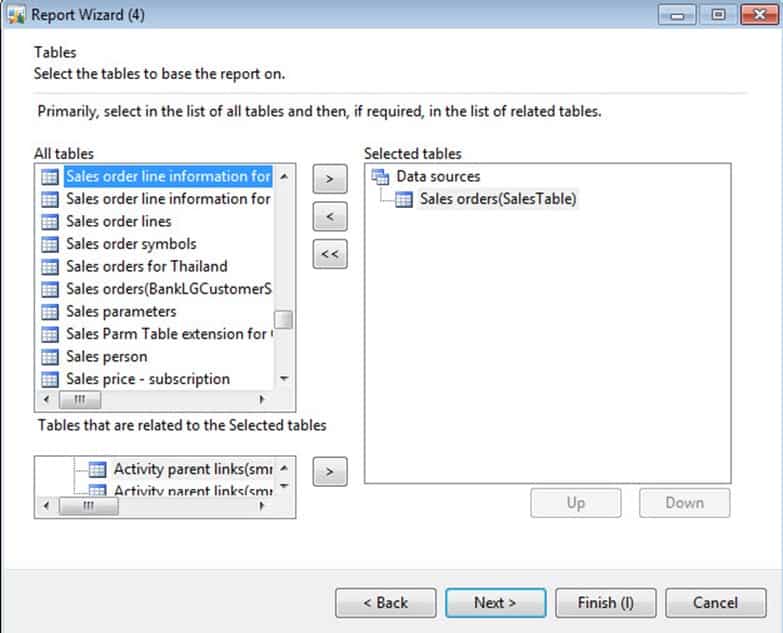
See this example of making things easier. On the All Tables à
Sales orders(SalesTable), double-click on Sales orders(SalesTable). Click Next after that.This part is too cool. It will show you all tables with human names. In the bottom panel, it will show you all of the tables that are related, so you can mix and match fields. It will then generate a query for you which takes care of all this in the background, making your job waaaaaay easier!!!!
-
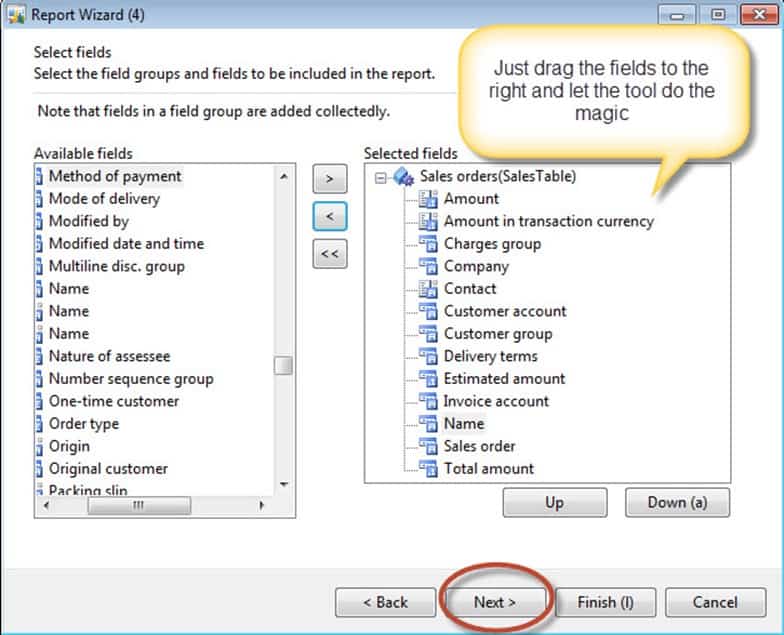
Next, we get to pick the fields through drag and drop. Make your fields on the right match this picture exactly before clicking Next. You should have 13 fields.
-
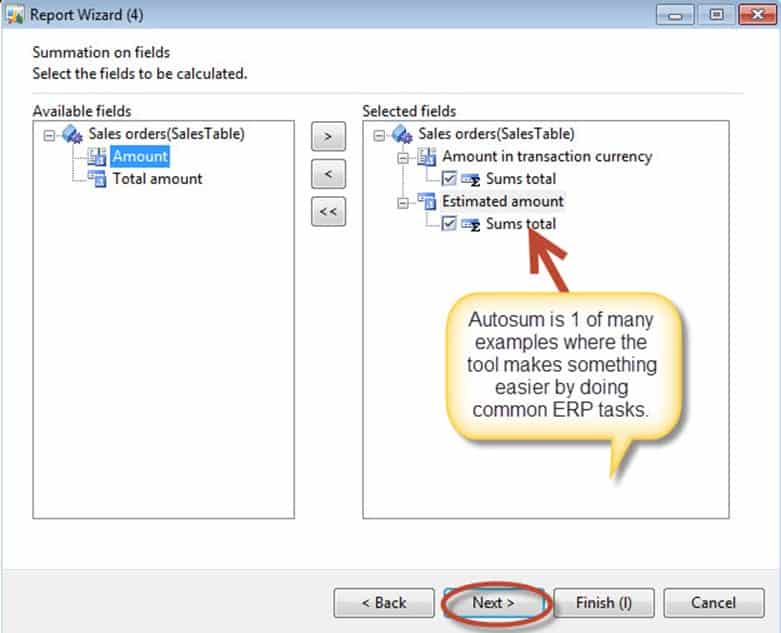
This wizard is pretty slick. It recognizes the fields that can be summed by default. You can uncheck them and overrule that, but it is very nice. Click Next when you are finished.
-
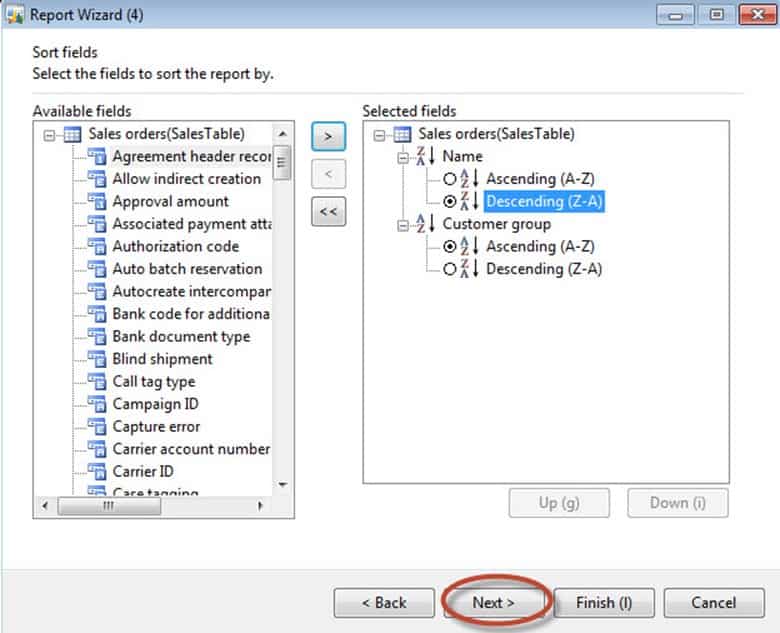
Now, choose the fields that you want to sort. Once again, drag and drop is in practice. Drag Name and Customer Group, make Name Descending and Customer Group Ascending. Click Next when finished. Notice how easy it is to sort by multiple fields.
-
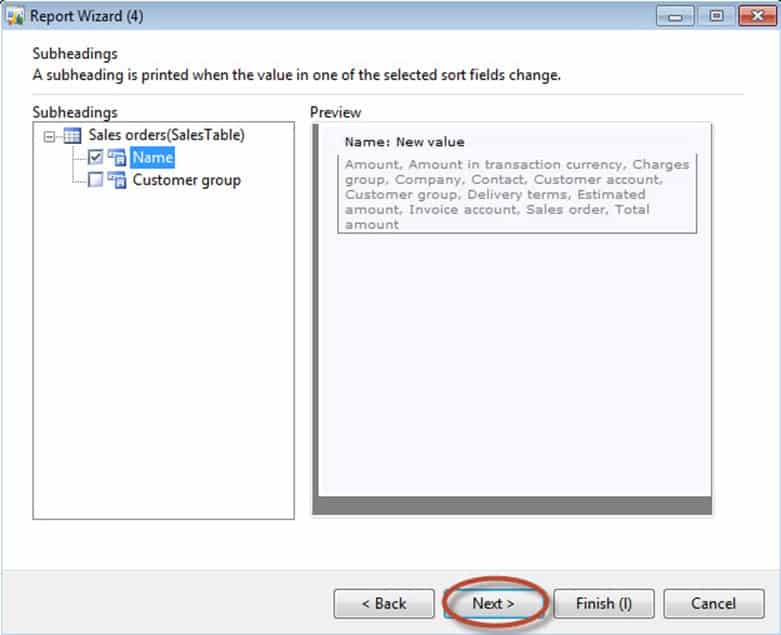
Now, this is really cool. Notice the preview which gives you the option of subheadings. Subheadings are a way bigger deal in ERP systems than regular reporting. Thankfully, this is all taken care of for us when we use the framework. Remember, let the framework take care of the highly common stuff while you focus on functionality and analytics. The templates will speed you up a lot!!!!
-
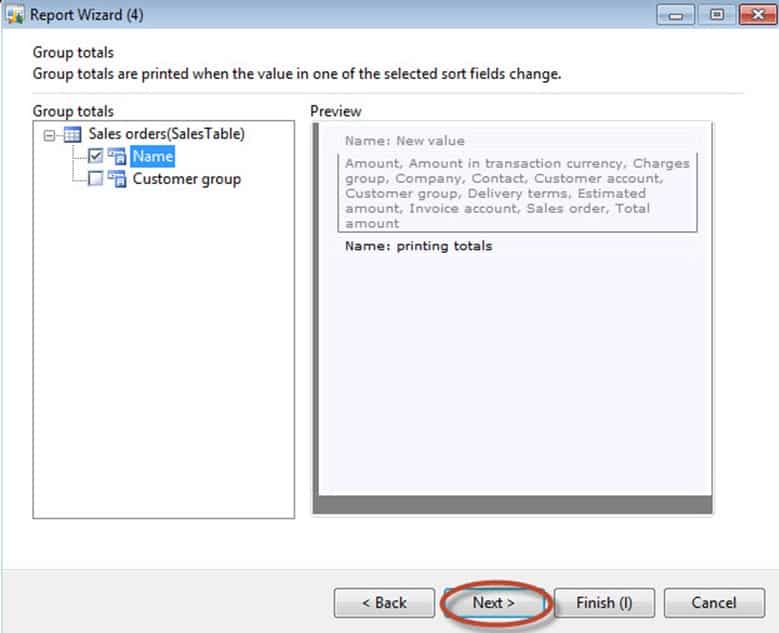
Now, this is another example of the AX Reporting framework in action. Here we are saying, that we want to display different group totals based on the Name field that a user selects. It’s a sort of Dynamic functionality that is hard to implement in SSRS without the Tabular or Cube model. Yes, there are differences between MorphX reporting and SSRS Dynamics AX reporting, but the main theme is still the same. Simplify the templating process so that we can develop reports which mean Dynamics AX needs much faster. Leave the options like the picture and click Next when finished.
-
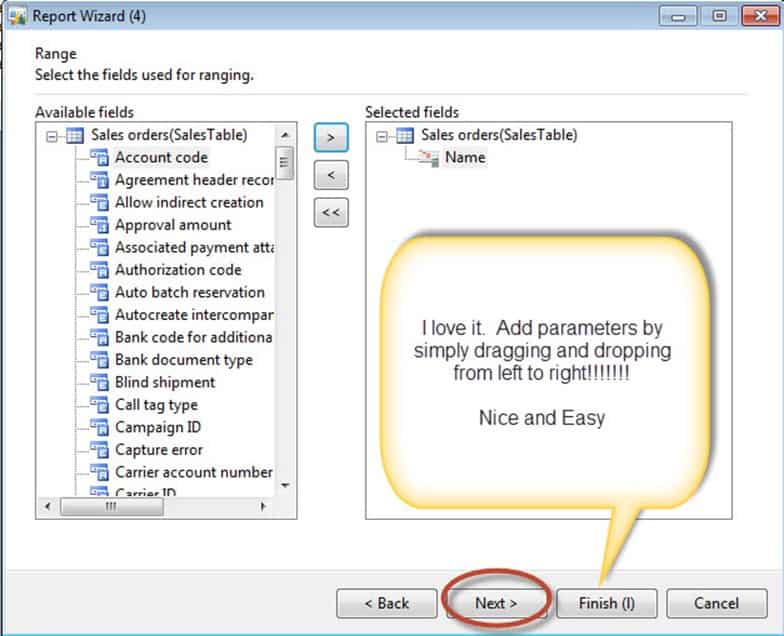
Now, range is really cool here. The fields that we choose here will become parameters in the report. Yuuuup, they will be used for filtering the results. It’s as easy as drag and drop. Drag the Name field over as we will only have one parameter to filter by on this simplified report.
-
Finally, choose the layout. And notice all the templates. Though this is a MorphX report in Dynamics AX 2012R2, notice the Report Template section. There are a ton of built-in templates, which make it really easy to develop reports. You can do everything from tables, to website templates, to special styles based upon ERP reports. Leave the options like the defaults and choose Next.

-
Congrats, you have made a report. You can choose to attach the report to a menu – meaning only people with the right security can launch it. Or you can try to print it out if you currently have data loaded on the cache. Click the Design button.

-
Then look at the Design definition. Pretty sweet, you did all of this by click through “next” options!!!

-
Finally, click Finished and you have made a MorphX report. Now, there were several things to learn from doing things the old way, mainly ease of use. What we will see about the new way is that many of those assumptions about ease of use are still there. But now, we can run our reports on the server instead of the client allowing for less client-side dependency.

Now that you have seen the old way and the assumptions that we make in Dynamics AX, I will be doing a frequently asked questions in Part 2 of this series. In Part 3, we jump into doing things the new way. We will find the reporting framework to be quite powerful with SSRS!

