Consulting, Microsoft Dynamics AX
The Simple Way to do Advanced Dynamics AX Troubleshooting(Walkthrough)
Having returned back to blogging after the recent birth of my newborn son, I have to say that I’ve missed it. So today, I thought that I would share one of my most coveted but simple methods of troubleshooting. But don’t be fooled. The methods here basically involve little more than the push of a button but that is because the tools are so powerful. You will learn how to pinpoint an error down to the hexadecimal code that it occupied on the server and the name of the action that it took when it got the error. This is extremely powerful information which often involves advanced debugging, but we are going to see how to do it the easy way – to where a non-technical person could easily do it and get a report that shows the exact error. Enjoy!!!!!
I’ve found that about 95% of the time, DEBUGDIAG will radically decrease your troubleshooting time with just the push of a button.
-
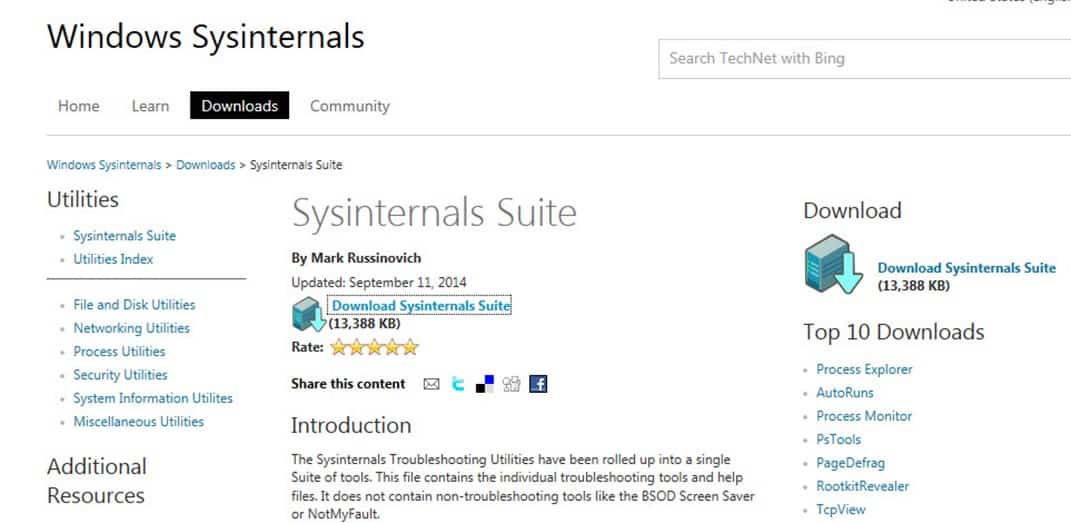
Download the SysInternals Suite and extract it to somewhere that you can find it
It’s all about the tools. Let’s use a Free, popular suite of tools that has been around forever and that you can download from Microsoft.
-
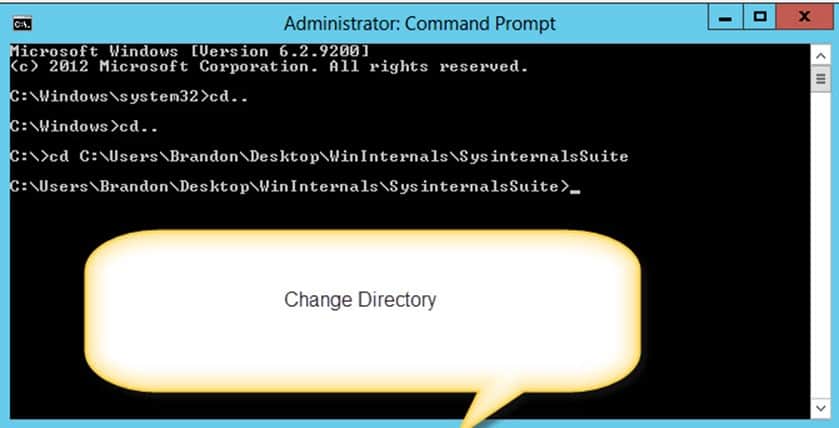
Now Bring Up the Command Prompt and change the directory to where the SysInternals tools are located
This is just a primer step. Run the Command Prompt as an administrator and change the directory to where you extracted the sysinternal tools.
-
Get the Process ID of Dynamics AX from Process Explorer
Double-click on the file “Procexp”

Now, locate the Process id of what you want to analyze. Here it is 3616 for the AX32Serv.exe, which is a process you will analyze a lot. That is what the AOS runs as. Note: each time that the AOS crashes, it will usually start up as a different process so keep that in mind. You have to repeat this process and get the ID.

-
Enter the command to capture a Dump and a location to save the dump files
When it comes to dumps, there is one rule. The more information you capture, the more accurate. However, the idea behind a dump is that it should also be as minimally invasive as possible. Dumps that are extremely large can cause your server to be down for hours capturing information. So, I always carefully weigh the situation. There are times where I really do need all the information. There are other times, however, where minimal data will do. Let me show you two different commands that you can enter, one is a full dump and the other is a partial dump.
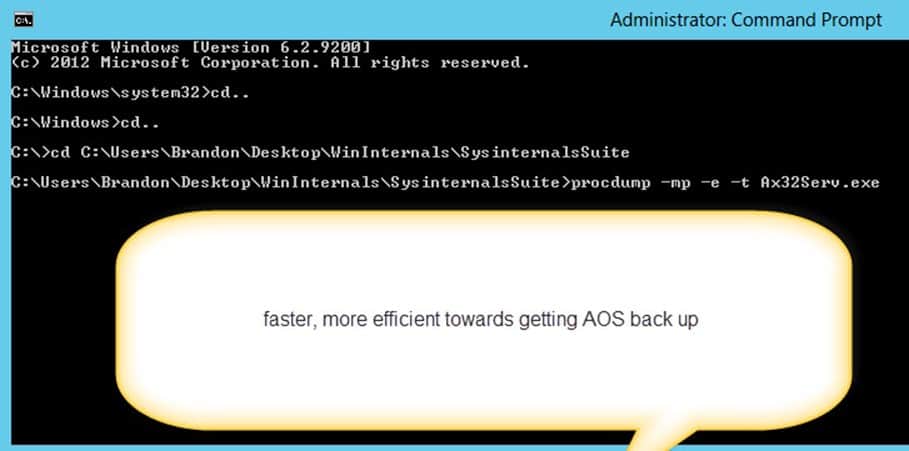
This is a full dump. The AX32serv.exe is the process name. The “e” means capture dumps whenever an exception occurs. The” t” says also capture dumps when the process terminates. Remember, a dump is like an audit file. It tells you what the application or process was using when it crashed.
Brandon Tip: Never base your recommendations on just one dump. Always use at least 3 dumps spread over multiple days. A dump will only tell you what is wrong and what the system was doing when the wrong happened. Sometimes, multiple things can cause wrongs at different times and you don’t want to sure that you have all the information when you recommend to a company how to fix their issue.
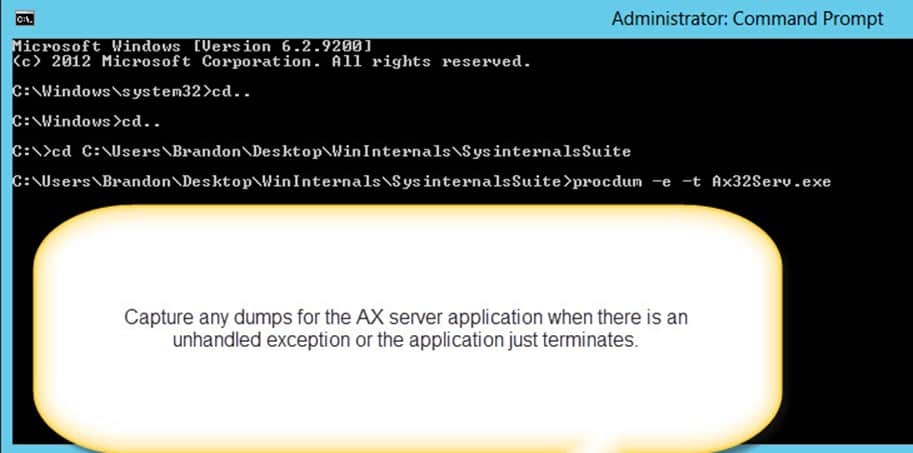
And here is a mini-dump example with AX if you are scared of disrupting Production
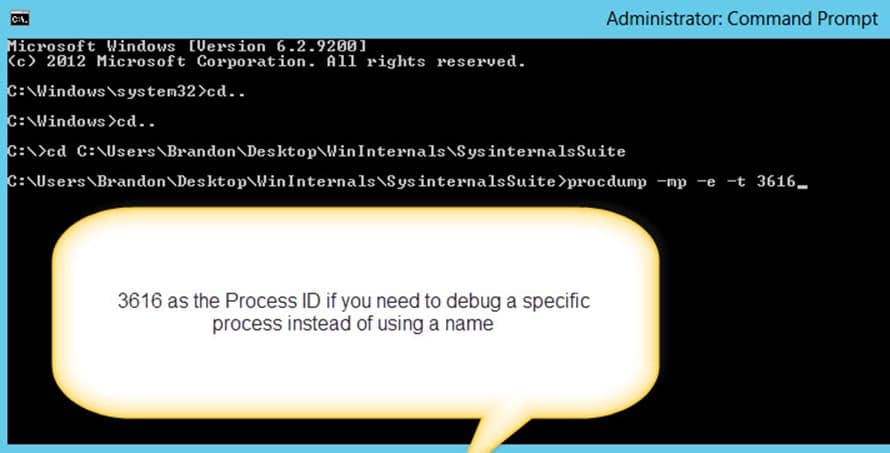
And one last example, if you prefer to use the process id, so that you get this simple yet powerful tool down
-
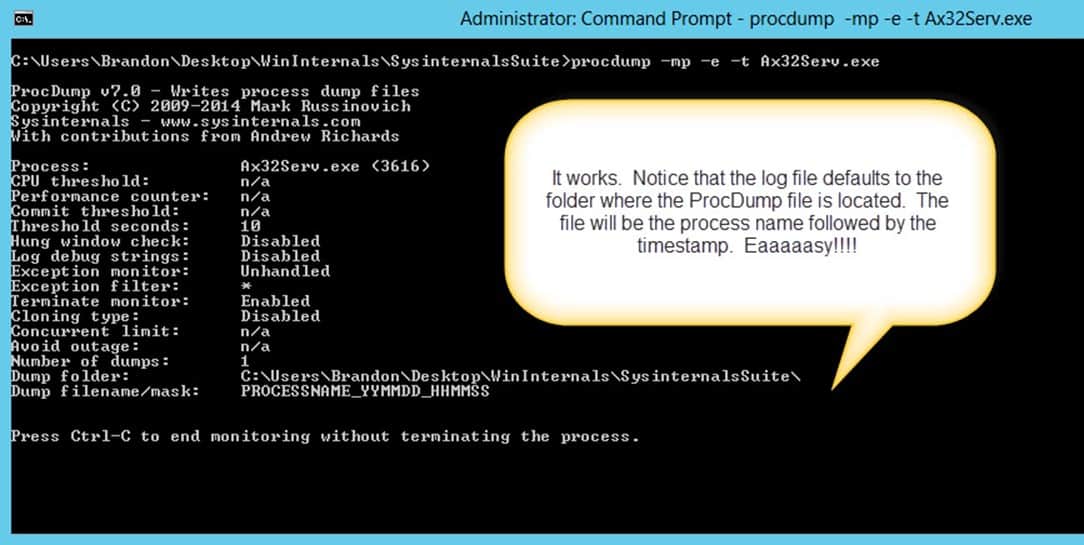
Press Enter on the command. Make sure that you see a confirmation that Procdump is running.
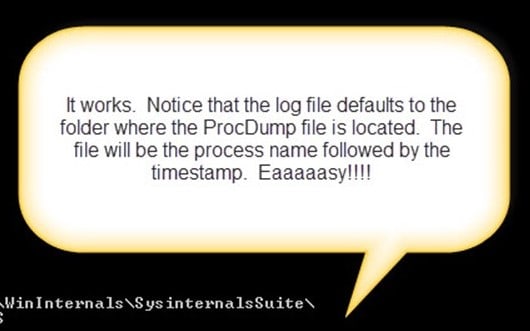
And here is an example of Procdump running. I went with the top option in this case.
-
Introduce a fake error for now.
This step is only done for the purpose of understanding. In real life, don’t do this. Any wayzzzzzzzzzzz, what is the easiest way to induce an error. Stop the SQL Server Service.
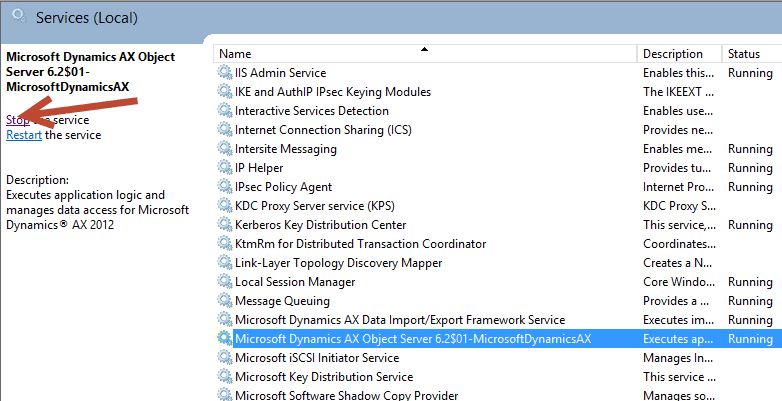
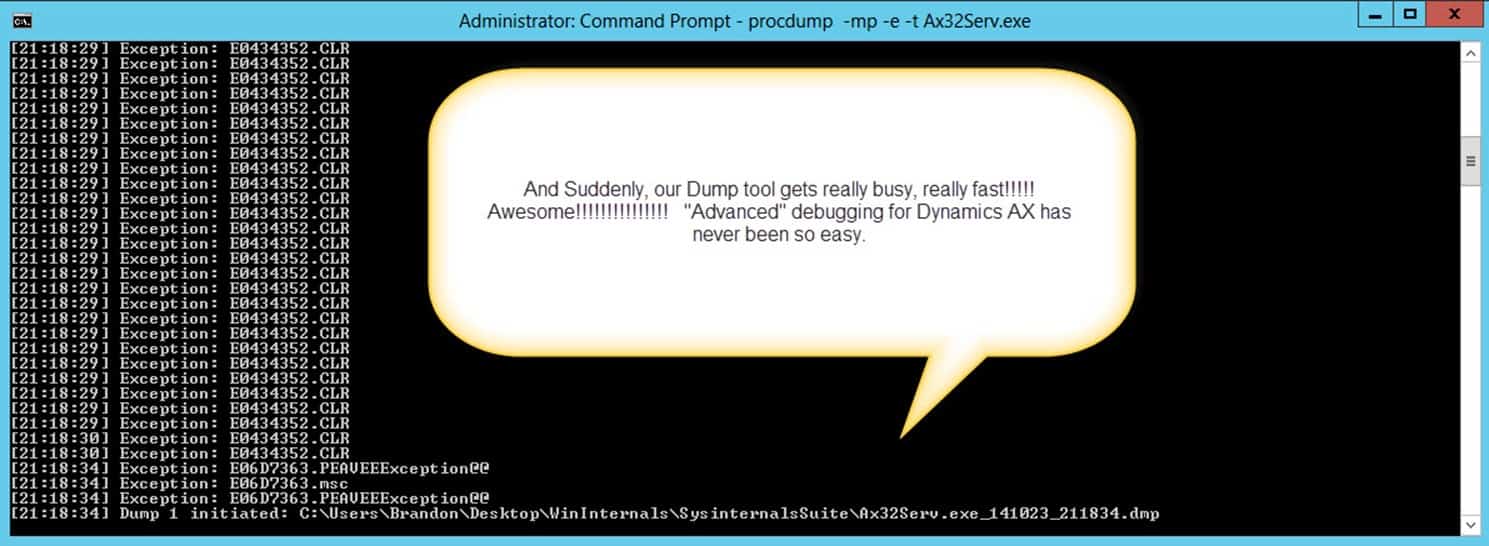
Observe how the log suddenly changes:
-
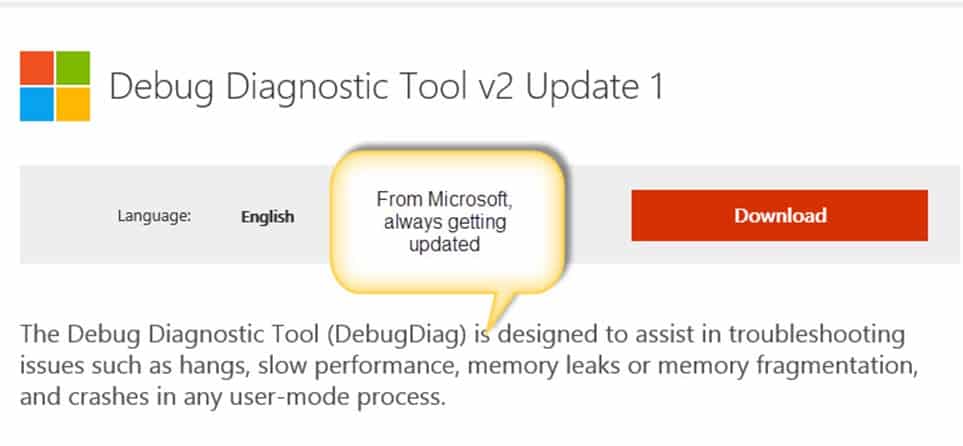
Download and Install the DebugDiag tool from Microsoft.
(currently located at http://www.microsoft.com/en-us/download/details.aspx?id=42933 but links change). People go back and forth between debugdiag and windbg but to me there is no argument. I’m old school, but use WinDbg for more advanced debugging with more controlled and use debugdiag the other 95% of the time when you want to rely on simplicity and it’s awesome autoanalyzing of memory leaks and application crashes with Dynamics AX. Here I will use Debugdiag. This is one of those wizard installs where you are safe to continue clicking “next” type of thing. Also, I prefer to use the 64-bit version of the debugdiag tool when analyzing Dynamics AX.
-
Open up the Debug Diag (not the Analysis Only version)
Now, because I love “simple”, I’m going to recommend that you do things the easy way. Open up the DebugDiag tool from a developer machine with the AOS running on it (so it can get the symbols). Make sure that you don’t open up the Analysis Version or you will have to load the symbols yourself which is more work. You don’t want to work here. You want things quick and easy as I’ll show in just a second.

-
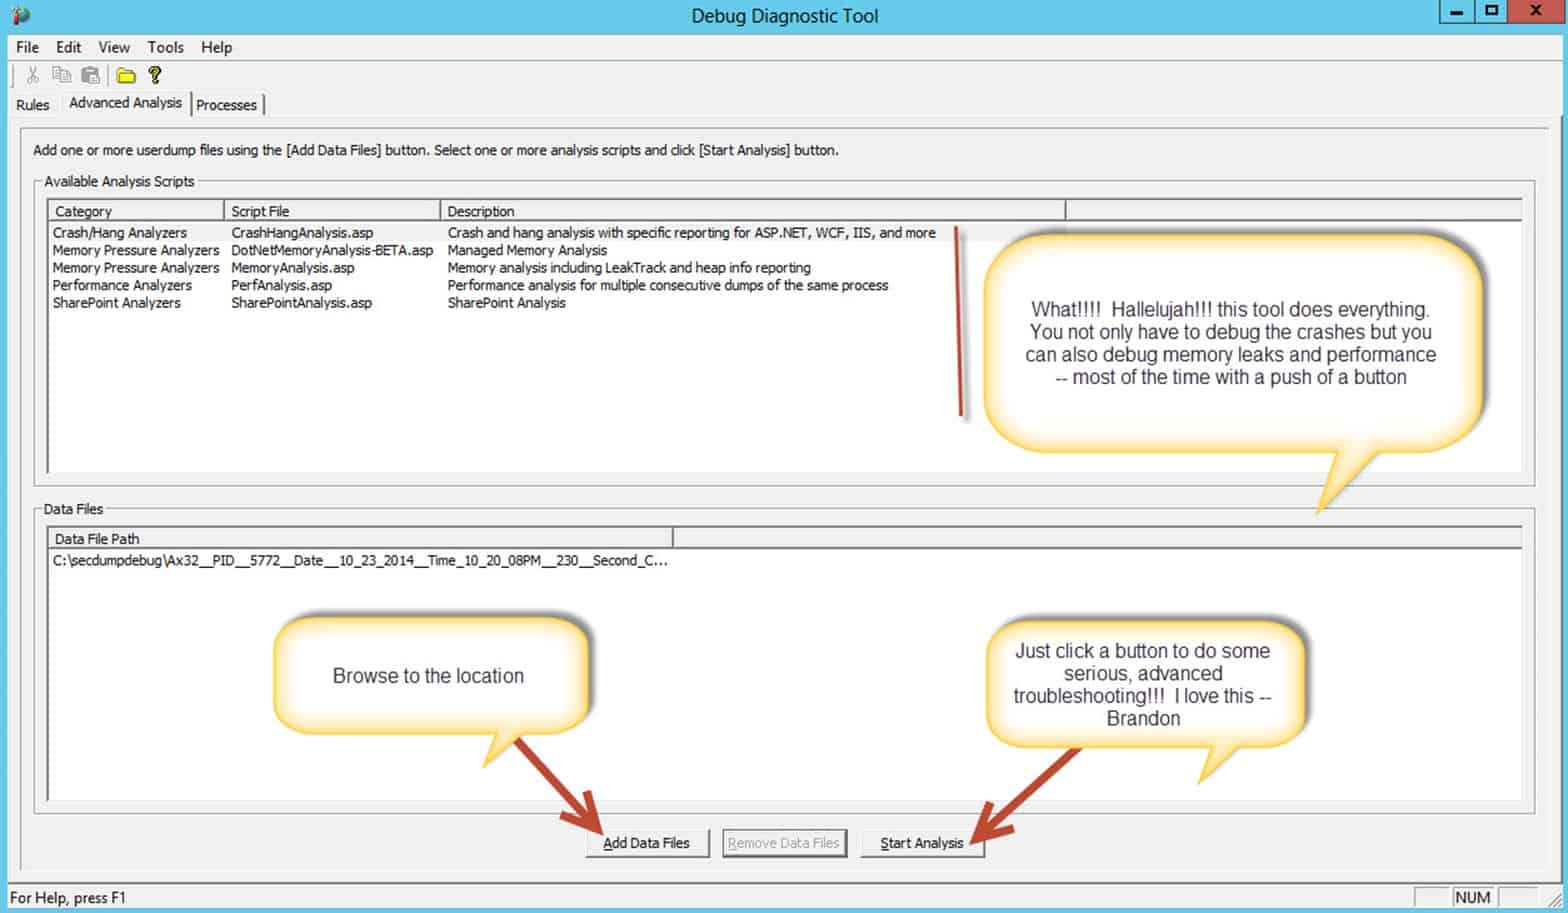
Choose the following option to run an automatic analysis where the system will use software algorithms to try and pinpoint the problem
Here is where things get really cool. The DebugDiag was built for analyzing memory leaks and crashes. You simply have to find the dump file and tell it to do what it does best.
-
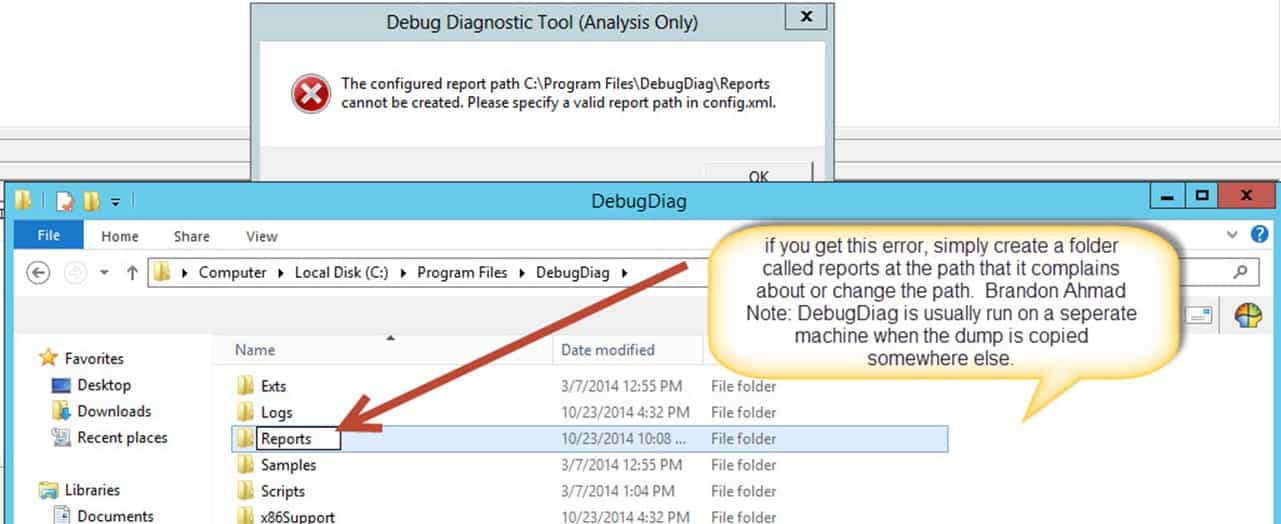
If you get irritating error..
If you get an irritating error saying that a path doesn’t exist, either create a folder at the specified location or simply change the report folder location to one that does exist. Here I just created a folder. Important Note: make sure that you do not run debugdiag directly on a production machine. Always copy the dump to another machine and run the analysis there (unless it is a development machine like the one that I am using for the demo).
-
Let’s see the Goodies!!!
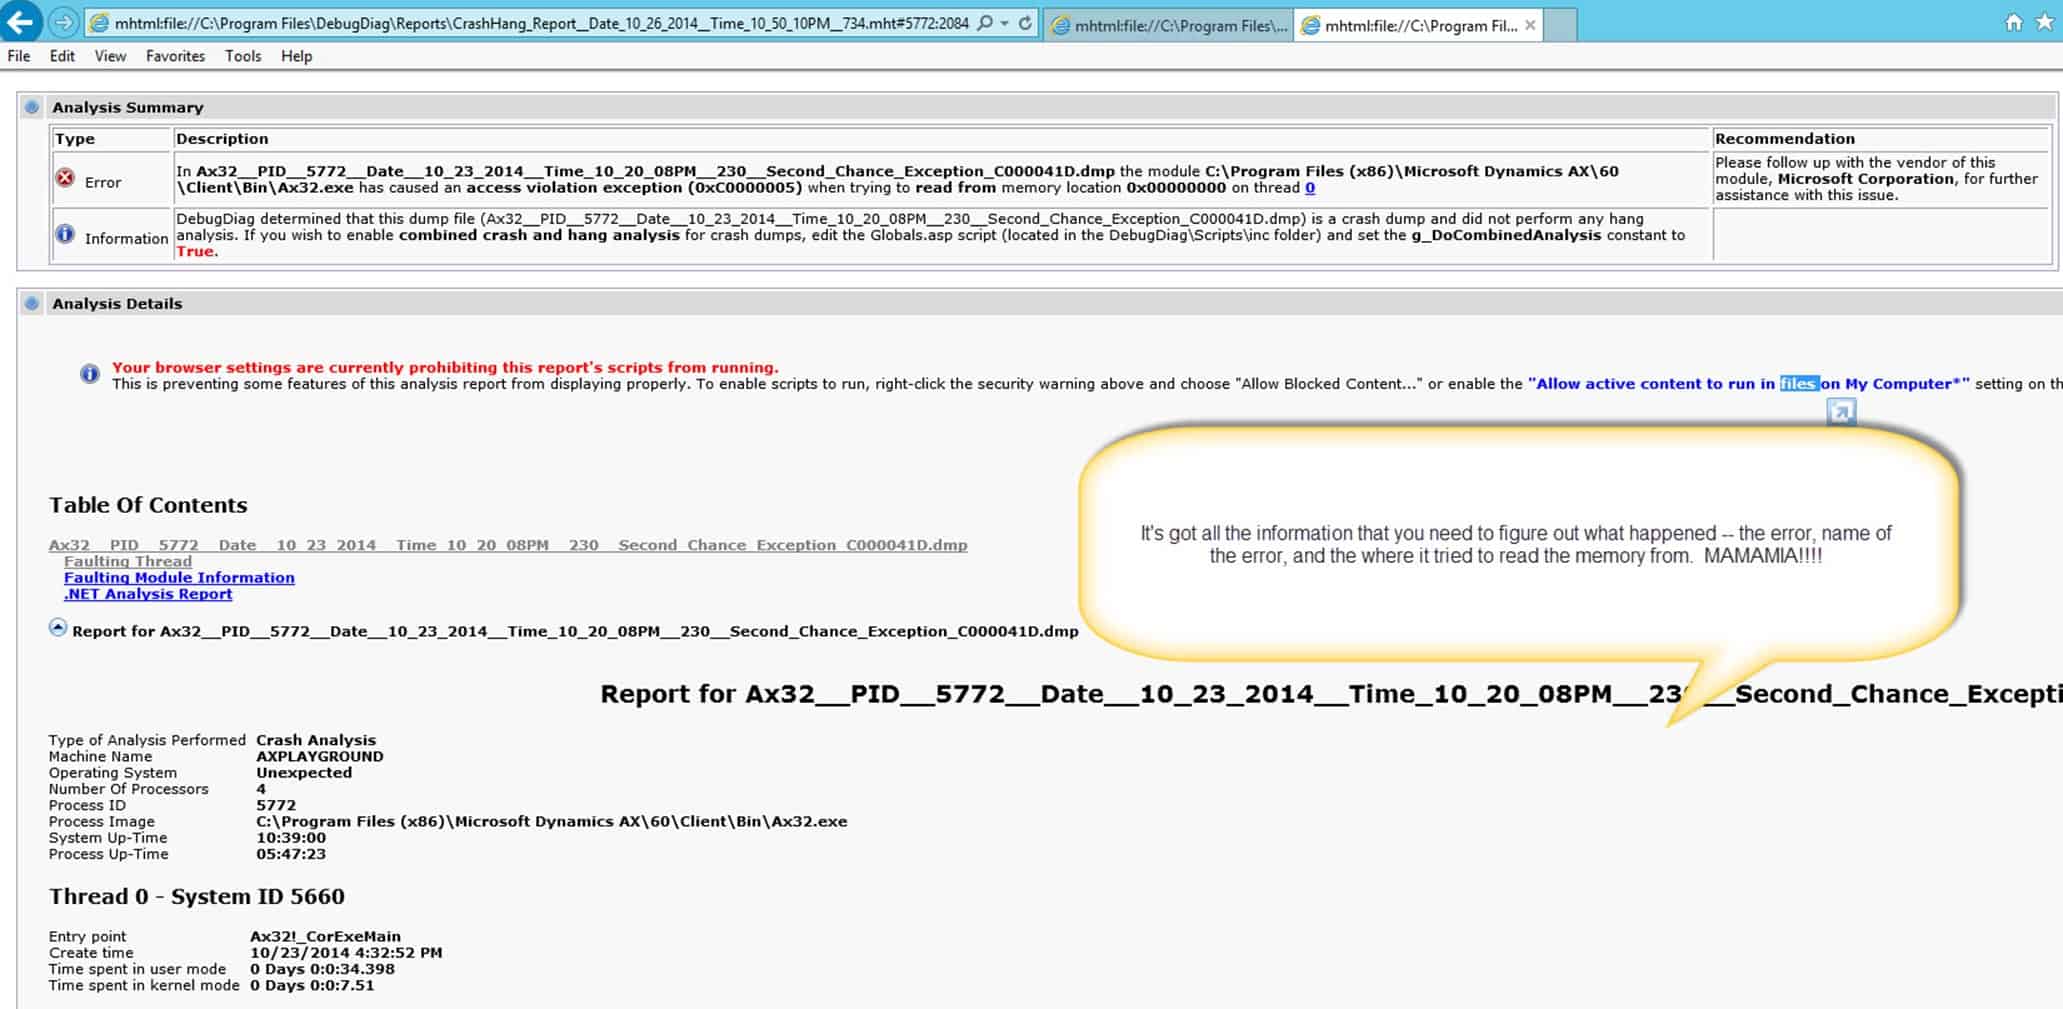
After clicking the button, “Start Analysis” watch how the DebugDiag tools comes to the rescue. It generates the cool Report “dealy” that shows you everything!!!! Here DebugDiag is telling you that Dynamics AX tried to read from memory that wasn’t there. The memory information wasn’t there because SQL server was no longer occupying that area of memory. AX can’t read what isn’t there.. (sidenote: sql server communication errors, consequently, are a classic cause of Access Violations).
-
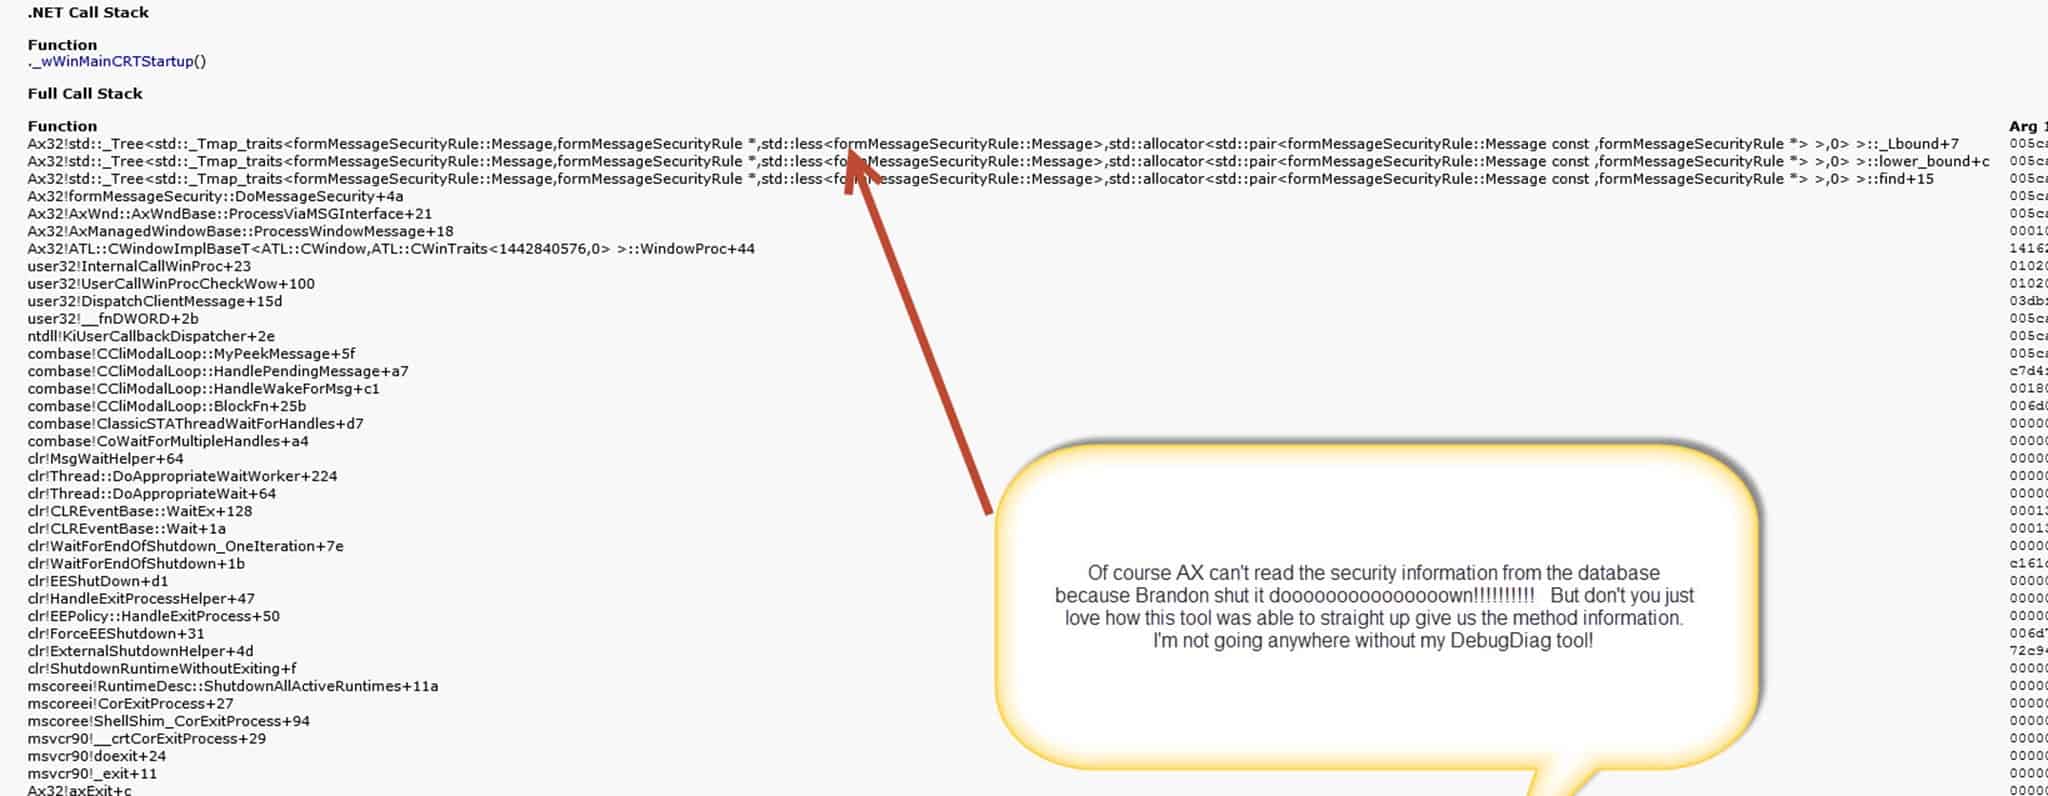
Wait, my screenshot didn’t show all of the awesome report. There is more!!!
It will even show you the methods that were called right up to the point of failure so that you can pinpoint EXACTLY what is failing and what is succeeding. No need to guess.
IN SUMMARY:
I have returned, albeit a little more tired due to sleepness nights with a crying newborn.. But don’t you just love when you can take complicated problems and make them far simpler. As I always preach on assignments, AX is all about the tricks of the trade. Tools like DebugDiag will allow you to do incredibly complicated analysis with just the push of a button. And I can say this. I’m an instructor first at heart, but I’m an AX architect by trade. People do notice when you can solve that big issue that has been haunting a company for a few months in a day or two with a tool like this. It really is an amazing and essential part of your AX toolkit. Well, I need to go change a baby diaper – a far more difficult ordeal than running the DebugDiag tool. Hope it helps you all as much as it has served me.

 13667
13667 